 Back to Torrens
Latest releases
The indicators updated in the latest releases of the Social Health Atlases of Australia are detailed below by release date. To view, refer to the Maps, Data or Graphs section of the website - or view the Topics, indicators and notes on the data for further information.
2026
Data release: 30 June 2026
Data release: By Population Health Area, Local Government Area, Primary Health Network, quintile of socioeconomic disadvantage of area (including within Primary Health Networks) and Remoteness Area
Social Health Atlases of Australia
Education
- Preschool enrolments at dedicated preschools - children aged 4 years old, 5 years old, 4 or 5 years old, 2025
- Preschool enrolments at centre based day care services - children aged 4 years old, 5 years old, 4 or 5 years old, 2025
- Enrolment of school leavers at a university, 2025
Bowel screening
- Bowel screening participation: males, females, persons, 2022 and 2023
- Bowel screening outcomes: positive screening result, males, females, persons, 2022 and 2023
Cancer incidence - Males
- Prostate cancer, 2017 to 2021
- Colorectal cancer, 2017 to 2021
- Melanoma of the skin, 2017 to 2021
- Lung cancer, 2017 to 2021
- Head and neck cancer, 2017 to 2021
- Lymphoma, 2017 to 2021
- Leukaemia, 2017 to 2021
- Bladder cancer, 2017 to 2021
- Kidney cancer, 2017 to 2021
- Pancreatic cancer, 2017 to 2021
- Stomach cancer, 2017 to 2021
- All cancers, 2017 to 2021
Cancer incidence - Females
- Breast cancer, 2017 to 2021
- Colorectal cancer, 2017 to 2021
- Melanoma of the skin, 2017 to 2021
- Lung cancer, 2017 to 2021
- Uterine cancer, 2017 to 2021
- Lymphoma, 2017 to 2021
- Thyroid cancer, 2017 to 2021
- Leukaemia, 2017 to 2021
- Ovarian cancer, 2017 to 2021
- Pancreatic cancer, 2017 to 2021
- All cancers, 2017 to 2021
Cancer incidence - Persons
- Colorectal cancer, 2017 to 2021
- Melanoma of the skin, 2017 to 2021
- Lung cancer, 2017 to 2021
- Lymphoma, 2017 to 2021
- Leukaemia, 2017 to 2021
- Pancreatic cancer, 2017 to 2021
- All cancers, 2017 to 2021
Click hereto access the maps for these atlases.
Click hereto access the graphs for these atlases.
Click hereto access the data for these atlases.
Data release: By Indigenous Area, Primary Health Networks, quintile of Indigenous Relative Socioeconomic Outcomes and Remoteness Areas
Aboriginal & Torres Strait Islander Social Health Atlases of Australia
Education
- Preschool enrolments at dedicated preschools: Aboriginal children aged 4 or 5 years, 2025
- Preschool enrolments at centre based day care services: Aboriginal children aged 4 or 5 years, 2025
- Enrolment of Aboriginal school leavers at a university, 2025
Click hereto access the maps for these atlases.
Click hereto access the graphs for these atlases.
Click hereto access the data for these atlases.
Data release: Indigenous Status Comparison: Social Health Atlas of Australia
The Indigenous Status Comparison: Social Health Atlas of Australia, presents selected topics and compares indicators between Indigenous and Non-Indigenous populations in Australia. This is available by Indigenous Areas, including total for the Greater Capital City Statistical Areas/Rest of States/NT; and States/Territories.
The topics and indicators in this latest release are listed below.
Education
- Preschool enrolments at dedicated preschools: Indigenous/ Non-Indigenous children aged 4 or 5 years, 2025
- Preschool enrolments at centre based day care services: Indigenous/ Non-Indigenous children aged 4 or 5 years, 2025
- Enrolment of Indigenous/ Non-Indigenous school leavers at a university, 2025
Click hereto access the maps for these atlases.
Click hereto access the graphs for these atlases.
Click hereto access the data for these atlases.
Data release: 31 March 2026
Data release: By Population Health Area, Local Government Area, Primary Health Network, quintile of socioeconomic disadvantage of area (including within Primary Health Networks) and Remoteness Area
Social Health Atlases of Australia
Education
- Participation in vocational education and training - Aboriginal population, 2024
- Participation in vocational education and training - Total population, 2024
- Subject completion rates in vocational education and training - Government-funded hours, 2024
- Subject completion rates in vocational education and training - Private-funded hours, 2024
- Subject completion rates in vocational education and training - Total student hours, 2024
- Subject completion rates in vocational education and training - Aboriginal student hours, 2024
Housing, rent assistance and vehicle access
- Households in dwellings receiving rent assistance from the Australian Government, June 2025
- Aboriginal households in dwellings receiving rent assistance from the Australian Government, June 2025
Income support recipients
- Age Pensioners, June 2025
- Disability Support Pensioners, June 2025
- Parenting Payment Single - Female recipients, June 2025
- People receiving an unemployment benefit, June 2025
- JobSeeker unemployment beneficiaries, June 2025
- Young people aged 16 to 21 receiving an unemployment benefit, June 2025
- People receiving an unemployment benefit for less than 6 months, June 2025
- People receiving an unemployment benefit for 6 months or more, June 2025
- Low income, welfare-dependent families (with children), June 2025
- Children in low income, welfare-dependent families, June 2025
- Pensioner Concession Card holders, June 2025
- Health Care Card holders, June 2025
- Seniors Health Card holders, June 2025
Child and youth health
- Infant mortality, 2019 to 2023
- Youth mortality, 2019 to 2023
Median age at death by sex
- Median age at death of males, females, persons, 2019 to 2023
Premature mortality by sex
- Deaths of males, females, persons aged 0 to 74 years, 2019 to 2023
Premature mortality by selected cause
- Deaths from cancer, people aged 0 to 74 years, 2019 to 2023
- Deaths from colorectal cancer, people aged 0 to 74 years, 2019 to 2023
- Deaths from lung cancer, people aged 0 to 74 years, 2019 to 2023
- Deaths from breast cancer, females aged 0 to 74 years, 2019 to 2023
- Deaths from pancreatic cancer, people aged 0 to 74 years, 2019 to 2023
- Deaths from lymphoid, haematopoietic and related tissue cancer, people aged 0 to 74 years, 2019 to 2023
- Deaths from diabetic, people aged 0 to 74 years, 2019 to 2023
- Deaths from circulatory system diseases, people aged 0 to 74 years, 2019 to 2023
- Deaths from ischaemic heart disease, people aged 0 to 74 years, 2019 to 2023
- Deaths from cerebrovascular diseases, people aged 0 to 74 years, 2019 to 2023
- Deaths from respiratory system diseases, people aged 0 to 74 years, 2019 to 2023
- Deaths from chronic obstructive pulmonary disease, people aged 0 to 74 years, 2019 to 2023
- Deaths from cirrhosis and other diseases of the liver, people aged 0 to 74 years, 2019 to 2023
- Deaths from external causes, people aged 0 to 74 years, 2019 to 2023
- Deaths from road traffic injuries, people aged 0 to 74 years, 2019 to 2023
- Deaths from suicide and self-inflicted injuries, people aged 0 to 74 years, 0 to 44 years and 0 to 74 years, 2019 to 2023
- Deaths from accidental poisoning, people aged 0 to 74 years, 2019 to 2023
- Deaths from COVID-19, people aged 0 to 74 years, 2019 to 2023 (Quintiles and Remoteness Areas only)
Avoidable mortality by sex
- Deaths from all avoidable causes, males, females, persons aged 0 to 74 years, 2019 to 2023
Avoidable mortality by selected cause
- Avoidable deaths from cancer, people aged 0 to 74 years, 2019 to 2023
- Avoidable deaths from colorectal cancer, people aged 0 to 74 years, 2019 to 2023
- Avoidable deaths from breast cancer, females aged 0 to 74 years, 2019 to 2023
- Avoidable deaths from diabetes, people aged 0 to 74 years, 2019 to 2023
- Avoidable deaths from circulatory system diseases, people aged 0 to 74 years, 2019 to 2023
- Avoidable deaths from ischaemic heart disease, people aged 0 to 74 years, 2019 to 2023
- Avoidable deaths from cerebrovascular diseases, people aged 0 to 74 years, 2019 to 2023
- Avoidable deaths from respiratory system diseases, people aged 0 to 74 years, 2019 to 2023
- Avoidable deaths from chronic obstructive pulmonary disease, people aged 0 to 74 years, 2019 to 2023
- Avoidable deaths from selected external causes of mortality (Falls; Fires, burns; Suicide and self-inflicted injuries; etc.), people aged 0 to 74 years, 2019 to 2023
- Avoidable deaths from suicide and self-inflicted injuries, people aged 0 to 74 years, 0 to 44 years, 45 to 74 years, 2019 to 2023
- Avoidable deaths from other external causes of mortality (Transport accidents; Accidental drowning and submersion; etc.), people aged 0 to 74 years, 2019 to 2023
- Avoidable deaths from transport accidents, people aged 0 to 74 years, 2019 to 2023
Potential years of life lost, by sex
- Potential years of life lost males, females, persons, 2019 to 2023
Potential years of life lost, by age and sex
- Potential years of life lost, males by broad age group (0 to 14, 15 to 24, 25 to 44, 45 to 64 and 65 to 74 years), 2019 to 2023
- Potential years of life lost, females by broad age group (0 to 14, 15 to 24, 25 to 44, 45 to 64 and 65 to 74 years), 2019 to 2023
- Potential years of life lost, persons by broad age group (0 to 14, 15 to 24, 25 to 44, 45 to 64 and 65 to 74 years), 2019 to 2023
Potential years of life lost, by selected cause
- Potential years of life lost from cancer (deaths before 75 years of age), 2019 to 2023
- Potential years of life lost from colorectal cancer (deaths before 75 years of age), 2019 to 2023
- Potential years of life lost from lung cancer (deaths before 75 years of age), 2019 to 2023
- Potential years of life lost from breast cancer (deaths before 75 years of age), 2019 to 2023
- Potential years of life lost from diabetes (deaths before 75 years of age), 2019 to 2023
- Potential years of life lost from circulatory system diseases (deaths before 75 years of age), 2019 to 2023
- Potential years of life lost from ischaemic heart disease (deaths before 75 years of age), 2019 to 2023
- Potential years of life lost from cerebrovascular diseases (deaths before 75 years of age), 2019 to 2023
- Potential years of life lost from respiratory system diseases (deaths before 75 years of age), 2019 to 2023
- Potential years of life lost from chronic obstructive pulmonary disease (deaths before 75 years of age), 2019 to 2023
- Potential years of life lost from external causes (deaths before 75 years of age), 2019 to 2023
- Potential years of life lost from road traffic injuries (deaths before 75 years of age), 2019 to 2023
- Potential years of life lost from suicide and self-inflicted injuries (deaths before 75 years of age), 2019 to 2023
Disability (NDIS) participants with autism (PHA and PHN only)
- National Disability Insurance Scheme (NDIS) participants with autism as a primary disability, by age, June 2025
Click hereto access the maps for these atlases.
Click hereto access the graphs for these atlases.
Click hereto access the data for these atlases.
Data release: By Indigenous Area, Primary Health Networks, quintile of Indigenous Relative Socioeconomic Outcomes and Remoteness Areas
Aboriginal & Torres Strait Islander Social Health Atlases of Australia
Education
- Participation of Aboriginal people in vocational education and training, 2024
- Subject completion rates in vocational education and training, Aboriginal students, 2024
Housing
- Aboriginal households in dwellings receiving rent assistance from the Australian Government, June 2025
Median age at death
- Median age at death of Aboriginal males, females, persons, 2019 to 2023
Premature mortality by age and sex
- Deaths of Aboriginal males aged 0 to 54 years, 2019 to 2023
- Deaths of Aboriginal females aged 0 to 54 years, 2019 to 2023
- Deaths of Aboriginal persons aged 0 to 54 years, 2019 to 2023
- Deaths of Aboriginal males aged 0 to 64 years, 2019 to 2023
- Deaths of Aboriginal females aged 0 to 64 years, 2019 to 2023
- Deaths of Aboriginal persons aged 0 to 64 years, 2019 to 2023
- Deaths of Aboriginal males aged 0 to 74 years, 2019 to 2023
- Deaths of Aboriginal females aged 0 to 74 years, 2019 to 2023
- Deaths of Aboriginal persons aged 0 to 74 years, 2019 to 2023
Premature mortality by selected cause
- Deaths from cancers, Aboriginal people: 0 to 54 years, 2019 to 2023
- Deaths from circulatory system diseases, Aboriginal people: 0 to 54 years, 2019 to 2023
- Deaths from external causes, Aboriginal people: 0 to 54 years, 2019 to 2023
- Deaths from cancers, Aboriginal people: 0 to 64 years, 2019 to 2023
- Deaths from circulatory system diseases, Aboriginal people: 0 to 64 years, 2019 to 2023
- Deaths from respiratory system diseases, Aboriginal people: 0 to 64 years, 2019 to 2023
- Deaths from external causes, Aboriginal people: 0 to 64 years, 2019 to 2023
- Deaths from cancers, Aboriginal people: 0 to 74 years, 2019 to 2023
- Deaths from lung cancers, Aboriginal people: 0 to 74 years, 2019 to 2023
- Deaths from diabetes, Aboriginal people: 0 to 74 years, 2019 to 2023
- Deaths from circulatory system diseases, Aboriginal people: 0 to 74 years, 2019 to 2023
- Deaths from ischaemic heart disease, Aboriginal people: 0 to 74 years, 2019 to 2023
- Deaths from respiratory system diseases, Aboriginal people: 0 to 74 years, 2019 to 2023
- Deaths from chronic obstructive pulmonary disease (COPD), Aboriginal people: 0 to 74 years, 2019 to 2023
- Deaths from cirrhosis and other diseases of the live, Aboriginal people: 0 to 74 years, 2019 to 2023
- Deaths from external causes, Aboriginal people: 0 to 74 years, 2019 to 2023
- Deaths from road traffic injuries, Aboriginal people: 0 to 74 years, 2019 to 2023
- Deaths from suicide and self-inflicted injuries, Aboriginal people: 0 to 74 years, 2019 to 2023
- Deaths from accidental poisoning, Aboriginal people: 0 to 74 years, 2019 to 2023
Avoidable mortality by sex
- Deaths from all avoidable causes, Aboriginal males, females, persons aged 0 to 74 years, 2019 to 2023
Avoidable mortality by selected cause
- Avoidable deaths from cancer, Aboriginal people aged 0 to 74 years, 2019 to 2023
- Avoidable deaths from diabetes, Aboriginal people aged 0 to 74 years, 2019 to 2023
- Avoidable deaths from circulatory system diseases, Aboriginal people aged 0 to 74 years, 2019 to 2023
- Avoidable deaths from ischaemic heart disease, Aboriginal people aged 0 to 74 years, 2019 to 2023
- Avoidable deaths from respiratory system diseases, Aboriginal people aged 0 to 74 years, 2019 to 2023
- Avoidable deaths from chronic obstructive pulmonary disease (COPD), Aboriginal people aged 0 to 74 years, 2019 to 2023
- Avoidable deaths from selected external causes, Aboriginal people aged 0 to 74 years, 2019 to 2023
- Avoidable deaths from suicide and self-inflicted injuries, Aboriginal people aged 0 to 74 years, 2019 to 2023
- Avoidable deaths from other external causes, Aboriginal people aged 0 to 74 years, 2019 to 2023
- Avoidable deaths from transport accidents, Aboriginal people aged 0 to 74 years, 2019 to 2023
Potential years of life lost by age and sex
- Potential years of life lost, Aboriginal males, females, persons aged 0 to 54 years, 2019 to 2023
- Potential years of life lost, Aboriginal males, females, persons aged 0 to 64 years, 2019 to 2023
- Potential years of life lost, Aboriginal males, females, persons aged 0 to 74 years, 2019 to 2023
Potential years of life lost by selected cause
- Potential years of life lost from cancer (deaths of Aboriginal people before 75 years of age), 2019 to 2023
- Potential years of life lost from lung cancer (deaths of Aboriginal people before 75 years of age), 2019 to 2023
- Potential years of life lost from diabetes (deaths of Aboriginal people before 75 years of age), 2019 to 2023
- Potential years of life lost from circulatory system diseases (deaths of Aboriginal people before 75 years of age), 2019 to 2023
- Potential years of life lost from ischaemic heart disease (deaths of Aboriginal people before 75 years of age), 2019 to 2023
- Potential years of life lost from respiratory system diseases (deaths of Aboriginal people before 75 years of age), 2019 to 2023
- Potential years of life lost from chronic obstructive pulmonary disease (COPD) (deaths of Aboriginal people before 75 years of age), 2019 to 2023
- Potential years of life lost from external causes (deaths of Aboriginal people before 75 years of age), 2019 to 2023
- Potential years of life lost from road traffic injuries (deaths of Aboriginal people before 75 years of age), 2019 to 2023
- Potential years of life lost from suicide and self-inflicted injuries (deaths of Aboriginal people before 75 years of age), 2019 to 2023
Click hereto access the maps for these atlases.
Click hereto access the graphs for these atlases.
Click hereto access the data for these atlases.
Data release: Indigenous Status Comparison: Social Health Atlas of Australia
The Indigenous Status Comparison: Social Health Atlas of Australia, presents selected topics and compares indicators between Indigenous and Non-Indigenous populations in Australia. This is available by Indigenous Areas, including total for the Greater Capital City Statistical Areas/Rest of States/NT; and States/Territories.
The topics and indicators in this latest release are listed below.
Education
- Participation of Indigenous/ Non-Indigenous people in vocational education and training, 2024
- Subject completion rates in vocational education and training, Indigenous/ Non-Indigenous students, 2024
Early childhood development: Australian Early Development Census (AEDC)
- Indigenous/ Non-Indigenous children developmentally vulnerable on one or more domains, 2024
- Indigenous/ Non-Indigenous children developmentally vulnerable on two or more domains, 2024
- Indigenous/ Non-Indigenous children developmentally on track on all five domains, 2024
- Physical health and wellbeing domain - Indigenous/ Non-Indigenous children developmentally vulnerable/ at risk/ on track, 2024
- Social competence domain - Indigenous/ Non-Indigenous children developmentally vulnerable/ at risk/ on track, 2024
- Emotional maturity - Indigenous/ Non-Indigenous children developmentally vulnerable/ at risk/ on track, 2024
- Language and cognitive skills (school-based) domain - Indigenous/ Non-Indigenous children developmentally vulnerable/ at risk/ on track, 2024
- Communication skills and general knowledge domain - Indigenous/ Non-Indigenous children developmentally vulnerable/ at risk/ on track, 2024
- Physical readiness for school day - Indigenous/ Non-Indigenous children developmentally vulnerable, 2024
- Physical independence - Indigenous/ Non-Indigenous children developmentally vulnerable, 2024
- Gross and fine motor skills - Indigenous/ Non-Indigenous children developmentally vulnerable, 2024
Median age at death
- Median age at death of Indigenous/Non-Indigenous males, females, persons, 2019 to 2023
Premature mortality by sex
- Indigenous/Non-Indigenous males, females, persons: 0 to 54 years, 2019 to 2023
- Indigenous/Non-Indigenous males, females, persons: 0 to 64 years, 2019 to 2023
- Indigenous/Non-Indigenous males, females, persons: 0 to 74 years, 2019 to 2023
Premature mortality by selected cause
- Cancers, Indigenous/Non-Indigenous people: 0 to 54 years,, 0 to 64 years, 0 to 74 years, 2019 to 2023
- Lung cancers, Indigenous/Non-Indigenous people: 0 to 74 years, 2019 to 2023
- Diabetes, Indigenous/Non-Indigenous people: 0 to 74 years, 2019 to 2023
- Circulatory system diseases, Indigenous/Non-Indigenous people: 0 to 54 years, 0 to 64 years, 0 to 74 years, 2019 to 2023
- Ischaemic heart disease, Indigenous/Non-Indigenous people: 0 to 74 years, 2019 to 2023
- Respiratory system diseases, Indigenous/Non-Indigenous people: 0 to 64 years, 0 to 74 years, 2019 to 2023
- Chronic obstructive pulmonary disease (COPD), Indigenous/Non-Indigenous people: 0 to 74 years, 2019 to 2023
- Cirrhosis and other diseases of the liver, Indigenous/Non-Indigenous people: 0 to 74 years, 2019 to 2023
- External causes, Indigenous/Non-Indigenous people: 0 to 54 years, 0 to 64 years, 0 to 74 years, 2019 to 2023
- Road traffic injuries, Indigenous/Non-Indigenous people: 0 to 74 years, 2019 to 2023
- Suicide and self-inflicted injuries, Indigenous/Non-Indigenous people: 0 to 74 years, 2019 to 2023
- Accidental poisoning, Indigenous/Non-Indigenous people: 0 to 74 years, 2019 to 2023
Avoidable mortality by sex
- Deaths from all avoidable causes, Indigenous/Non-Indigenous males, females, persons aged 0 to 74 years, 2019 to 2023
Avoidable mortality by selected cause
- Avoidable deaths from cancer, Indigenous/Non-Indigenous people aged 0 to 74 years, 2019 to 2023
- Avoidable deaths from diabetes, Indigenous/Non-Indigenous people aged 0 to 74 years, 2019 to 2023
- Avoidable deaths from circulatory system diseases, Indigenous/Non-Indigenous people aged 0 to 74 years, 2019 to 2023
- Avoidable deaths from ischaemic heart disease, Indigenous/Non-Indigenous people aged 0 to 74 years, 2019 to 2023
- Avoidable deaths from respiratory system diseases, Indigenous/Non-Indigenous people aged 0 to 74 years, 2019 to 2023
- Avoidable deaths from chronic obstructive pulmonary disease (COPD), Indigenous/Non-Indigenous people aged 0 to 74 years, 2019 to 2023
- Avoidable deaths from selected external causes, Indigenous/Non-Indigenous people aged 0 to 74 years, 2019 to 2023
- Avoidable deaths from suicide and self-inflicted injuries, Indigenous/ Non-Indigenous people aged 0 to 74 years, 2019 to 2023
- Avoidable deaths from other external causes, Indigenous/Non-Indigenous people aged 0 to 74 years, 2019 to 2023
- Avoidable deaths from transport accidents, Indigenous/Non-Indigenous people aged 0 to 74 years, 2019 to 2023
Potential years of life lost by age and sex
- Indigenous/Non-Indigenous males, females, persons aged 0 to 54 years, 2019 to 2023
- Indigenous/Non-Indigenous males, females, persons aged 0 to 64 years, 2019 to 2023
- Indigenous/Non-Indigenous males, females, persons aged 0 to 74 years, 2019 to 2023
Potential years of life lost by selected cause
- Potential years of life lost from cancer, Indigenous/Non-Indigenous people aged 0-74 years 2019 to 2023
- Potential years of life lost from lung cancer, Indigenous/Non-Indigenous people aged 0-74 years, 2019 to 2023
- Potential years of life lost from diabetes, Indigenous/Non-Indigenous people aged 0-74 years, 2019 to 2023
- Potential years of life lost from circulatory system diseases, Indigenous/Non-Indigenous people aged 0-74 years, 2019 to 2023
- Potential years of life lost from ischaemic heart disease, Indigenous/Non-Indigenous people aged 0-74 years, 2019 to 2023
- Potential years of life lost from respiratory system diseases, Indigenous/Non-Indigenous people aged 0-74 years, 2019 to 2023
- Potential years of life lost from chronic obstructive pulmonary disease (COPD), Indigenous/Non-Indigenous people aged 0-74 years, 2019 to 2023
- Potential years of life lost from external causes, Indigenous/Non-Indigenous people aged 0-74 years, 2019 to 2023
- Potential years of life lost from road traffic injuries, Indigenous/Non-Indigenous people aged 0-74 years, 2019 to 2023
- Potential years of life lost from suicide and self-inflicted injuries, Indigenous/Non-Indigenous people aged 0-74 years, 2019 to 2023
Click hereto access the maps for these atlases.
Click hereto access the graphs for these atlases.
Click hereto access the data for these atlases.
Data release: 16 March 2026
Topic-Specific Atlases: Child and Youth Social Health Atlas of Australia
Child and Youth Social Health Atlas of Australia
Being healthy in childhood and as young people provides an important foundation for later life. This second edition of the Child and Youth Social Health Atlas of Australia draws together data from other Social Health Atlases and unpublished data for those aged from 0 to 24 years. As such, it seeks to set the data on health status, use of health services and health outcomes alongside the demographic, social and economic characteristics of this population group in the communities where they live across Australia.
Click here to access the atlas.
2025
Data release: 13 December 2025
Data release: By Population Health Area, Local Government Area, Primary Health Network, quintile of socioeconomic disadvantage of area (including within Primary Health Networks) and Remoteness Area
Social Health Atlases of Australia
Fertility rate
- Total fertility rate, 2024
Early childhood development: Australian Early Development Census
- Developmentally vulnerable on one or more domains, 2024
- Developmentally vulnerable on two or more domains, 2024
- Developmentally on track on all five domains, 2024
- Physical health and wellbeing domain, 2024
- Social competence domain, 2024
- Emotional maturity, 2024
- Language and cognitive skills (school-based) domain, 2024
- Communication skills and general knowledge domain, 2024
- Physical readiness for school day, 2024
- Physical independence, 2024
- Gross and fine motor skills , 2024
Labour force
- Unemployment, June 2025
- Labour force participation, June 2025
Aged care places
- Residential aged care places, 30 June 2025
Commonwealth Home Support Programme
- Clients living alone, 2023/24
- Clients with carer, 2023/24
- Indigenous clients (per total clients), 2023/24
- Indigenous clients (per Indigenous population), 2023/24
- Non-English-speaking clients, 2023/24
- Total clients, 2023/24
- Allied health therapy clients, 2023/24
- Domestic assistance clients, 2023/24
- Flexible respite clients, 2023/24
- Goods and equipment clients, 2023/24
- Home maintenance clients, 2023/24
- Home modification clients, 2023/24
- Meals clients, 2023/24
- Nursing clients, 2023/24
- Personal care clients, 2023/24
- Social support (group) clients, 2023/24
- Social support (individual) clients, 2023/24
- Specialised support services clients, 2023/24
- Transport clients, 2023/24
Potentially preventable hospitalisations, Public hospitals - by broad age groups
Errata: Note that the populations used to calculate rates in the 2020/21 dataset were inaccurate. Revised data with corrected rates were published in December 2025.
- Potentially preventable conditions, aged 0 to 14 years, 2020/21
- Potentially preventable conditions, aged 15 to 24 years, 2020/21
- Potentially preventable conditions, aged 25 to 44 years, 2020/21
- Potentially preventable conditions, aged 45 to 64 years, 2020/21
- Potentially preventable conditions, aged 65 years and over, 2020/21
- Potentially preventable conditions, aged 75 years and over, 2020/21
- All potentially preventable conditions, 2020/21
Potentially preventable hospitalisations, Public hospitals - Vaccine-preventable conditions
Errata: Note that the populations used to calculate rates in the 2020/21 dataset were inaccurate. Revised data with corrected rates were published in December 2025.
- Vaccine-preventable conditions - pneumonia and influenza, 2020/21
- Total vaccine-preventable conditions, 2020/21
Potentially preventable hospitalisations, Public hospitals - Acute conditions
Errata: Note that the populations used to calculate rates in the 2020/21 dataset were inaccurate. Revised data with corrected rates were published in December 2025.
- Acute cellulitis, 2020/21
- Acute convulsions and epilepsy, 2020/21
- Acute dental conditions, 2020/21
- Acute ear, nose and throat infections , 2020/21
- Acute gangrene, 2020/21
- Acute urinary tract infections, including pyelonephritis, 2020/21
- Total acute conditions, 2020/21
Potentially preventable hospitalisations, Public hospitals - Chronic conditions
Errata: Note that the populations used to calculate rates in the 2020/21 dataset were inaccurate. Revised data with corrected rates were published in December 2025.
- Chronic angina, 2020/21
- Chronic asthma, 2020/21
- Chronic congestive cardiac failure, 2020/21
- Chronic obstructive pulmonary disease (COPD), 2020/21
- Chronic diabetes complications, 2020/21
- Chronic hypertension, 2020/21
- Chronic iron deficiency anaemia, 2020/21
- Total chronic conditions, 2020/21
Click hereto access the maps for these atlases.
Click hereto access the graphs for these atlases.
Click hereto access the data for these atlases.
Data release: By Indigenous Area, Primary Health Networks, quintile of Indigenous Relative Socioeconomic Outcomes and Remoteness Areas
Aboriginal & Torres Strait Islander Social Health Atlases of Australia
Early childhood development: Australian Early Development Census (AEDC)
- Aboriginal children developmentally vulnerable on one or more domains, 2024
- Aboriginal children developmentally vulnerable on two or more domains, 2024
- Aboriginal children developmentally on track on all five domains, 2024
- Physical health and wellbeing domain - Aboriginal children developmentally vulnerable/ at risk/ on track, 2024
- Social competence domain - Aboriginal children developmentally vulnerable/ at risk/ on track, 2024
- Emotional maturity - Aboriginal children developmentally vulnerable/ at risk/ on track, 2024
- Language and cognitive skills (school-based) domain - Aboriginal children developmentally vulnerable/ at risk/ on track, 2024
- Communication skills and general knowledge domain - Aboriginal children developmentally vulnerable/ at risk/ on track, 2024
- Physical readiness for school day - Aboriginal children developmentally vulnerable, 2024
- Physical independence - Aboriginal children developmentally vulnerable, 2024
- Gross and fine motor skills - Aboriginal children developmentally vulnerable, 2024
Commonwealth Home Support Programme
- Aboriginal clients living alone, 2023/24
- Aboriginal clients with carer, 2023/24
- Total Aboriginal clients, 2023/24
Potentially preventable hospitalisations by age
Note: Potentially preventable hospitalisations data are currently unavailable for 2019/20 to 2022/23. In the interim, data for 2017/18 to 2020/21 have been published.
- Potentially preventable conditions, Aboriginal people aged 0 to 14 years, 2017/18 to 2020/21
- Potentially preventable conditions, Aboriginal people aged 15 to 24 years, 2017/18 to 2020/21
- Potentially preventable conditions, Aboriginal people aged 25 to 44 years, 2017/18 to 2020/21
- Potentially preventable conditions, Aboriginal people aged 45 to 64 years, 2017/18 to 2020/21
- Potentially preventable conditions, Aboriginal people aged 65 years and over, 2017/18 to 2020/21
- Potentially preventable conditions, Aboriginal people, 2017/18 to 2020/21
Potentially preventable hospitalisations - Vaccine-preventable conditions
Note: Potentially preventable hospitalisations data are currently unavailable for 2019/20 to 2022/23. In the interim, data for 2017/18 to 2020/21 have been published.
- Vaccine-preventable conditions - pneumonia and influenza, Aboriginal people, 2017/18 to 2020/21
- Total vaccine-preventable conditions, Aboriginal people, 2017/18 to 2020/21
Potentially preventable hospitalisations - Acute conditions
Note: Potentially preventable hospitalisations data are currently unavailable for 2019/20 to 2022/23. In the interim, data for 2017/18 to 2020/21 have been published.
- Acute cellulitis, Aboriginal people, 2017/18 to 2020/21
- Acute convulsions and epilepsy, Aboriginal people, 2017/18 to 2020/21
- Acute dental conditions, Aboriginal people, 2017/18 to 2020/21
- Acute ear, nose and throat infections, Aboriginal people, 2017/18 to 2020/21
- Acute urinary tract infections, including pyelonephritis, Aboriginal people, 2017/18 to 2020/21
- Total acute conditions, Aboriginal people, 2017/18 to 2020/21
Potentially preventable hospitalisations - Chronic conditions
Note: Potentially preventable hospitalisations data are currently unavailable for 2019/20 to 2022/23. In the interim, data for 2017/18 to 2020/21 have been published.
- Chronic angina, Aboriginal people, 2017/18 to 2020/21
- Chronic asthma, Aboriginal people, 2017/18 to 2020/21
- Chronic congestive cardiac failure, Aboriginal people, 2017/18 to 2020/21
- Chronic obstructive pulmonary disease (COPD), Aboriginal people, 2017/18 to 2020/21
- Chronic diabetes complications, Aboriginal people, 2017/18 to 2020/21
- Chronic iron deficiency anaemia, Aboriginal people, 2017/18 to 2020/21
- Total chronic conditions, Aboriginal people, 2017/18 to 2020/21
Click hereto access the maps for these atlases.
Click hereto access the graphs for these atlases.
Click hereto access the data for these atlases.
Data release: Indigenous Status Comparison: Social Health Atlas of Australia
The Indigenous Status Comparison: Social Health Atlas of Australia, presents selected topics and compares indicators between Indigenous and Non-Indigenous populations in Australia. This is available by Indigenous Areas, including total for the Greater Capital City Statistical Areas/Rest of States/NT; and States/Territories.
The topics and indicators in this latest release are listed below.
Potentially preventable hospitalisations by age
Errata: Note that the Australian standard used to calculate the rates for the potentially preventable hospitalisations data previously excluded “not stated” Indigenous status. Revised data with the corrected total Australian standard were released in December 2025.
- Potentially preventable conditions, Indigenous/ non-Indigenous people aged 0 to 14 years, 2017/18 to 2020/21
- Potentially preventable conditions, Indigenous/ non-Indigenous people aged 15 to 24 years, 2017/18 to 2020/21
- Potentially preventable conditions, Indigenous/ non-Indigenous people aged 25 to 44 years, 2017/18 to 2020/21
- Potentially preventable conditions, Indigenous/ non-Indigenous people aged 45 to 64 years, 2017/18 to 2020/21
- Potentially preventable conditions, Indigenous/ non-Indigenous people aged 65 years and over, 2017/18 to 2020/21
- Potentially preventable conditions, Indigenous/ non-Indigenous people, 2017/18 to 2020/21
Potentially preventable hospitalisations - Vaccine-preventable conditions
Errata: Note that the Australian standard used to calculate the rates for the potentially preventable hospitalisations data previously excluded “not stated” Indigenous status. Revised data with the corrected total Australian standard were released in December 2025.
- Vaccine-preventable conditions - pneumonia and influenza, Indigenous/ non-Indigenous people, 2017/18 to 2020/21
- Total Vaccine-preventable conditions, Indigenous/ non-Indigenous people, 2017/18 to 2020/21
Potentially preventable hospitalisations - Acute conditions
Errata: Note that the Australian standard used to calculate the rates for the potentially preventable hospitalisations data previously excluded “not stated” Indigenous status. Revised data with the corrected total Australian standard were released in December 2025.
- Acute cellulitis, Indigenous/ non-Indigenous people, 2017/18 to 2020/21
- Acute convulsions and epilepsy, Indigenous/ non-Indigenous people, 2017/18 to 2020/21
- Acute dental conditions, Indigenous/ non-Indigenous people, 2017/18 to 2020/21
- Acute ear, nose and throat infections, Indigenous/ non-Indigenous people, 2017/18 to 2020/21
- Acute urinary tract infections, including pyelonephritis, Indigenous/ non-Indigenous people, 2017/18 to 2020/21
- Total acute conditions, Indigenous/ non-Indigenous people, 2017/18 to 2020/21
Potentially preventable hospitalisations - Chronic conditions
Errata: Note that the Australian standard used to calculate the rates for the potentially preventable hospitalisations data previously excluded “not stated” Indigenous status. Revised data with the corrected total Australian standard were released in December 2025.
- Chronic angina, Indigenous/ non-Indigenous people, 2017/18 to 2020/21
- Chronic asthma, Indigenous/ non-Indigenous people, 2017/18 to 2020/21
- Chronic congestive cardiac failure, Indigenous/ non-Indigenous people, 2017/18 to 2020/21
- Chronic obstructive pulmonary disease (COPD), Indigenous/ non-Indigenous people, 2017/18 to 2020/21
- Chronic diabetes complications, Indigenous/ non-Indigenous people, 2017/18 to 2020/21
- Chronic iron deficiency anaemia, Indigenous/ non-Indigenous people, 2017/18 to 2020/21
- Total chronic conditions, Indigenous/ non-Indigenous people, 2017/18 to 2020/21
Click hereto access the maps for these atlases.
Click hereto access the graphs for these atlases.
Click hereto access the data for these atlases.
Data release: 30 September 2025
Data release: By Population Health Area, Local Government Area, Primary Health Network, quintile of socioeconomic disadvantage of area (including within Primary Health Networks) and Remoteness Area
Social Health Atlases of Australia
Age distribution - estimated resident population (ERP)
- Age distribution - 5 years age groups, and broad age groups: Males, Females, Persons (ERP), 2024
Private health insurance
- Private health insurance, 2022-23
Health workforce (LGA and PHN only)
- Total Psychologists, 2023
- Total Psychiatrists, 2023
Disability (NDIS) (PHA and PHN only)
- National Disability Insurance Scheme (NDIS) active participants by age group, December 2024
Admissions by hospital type and sex (excluding same-day admissions for renal dialysis)
- Male total admissions - Public, All hospitals, 2022/23
- Female total admissions - Public, All hospitals, 2022/23
- Total admissions - Public, Private, All hospitals, 2022/23
Admissions by principal diagnosis, Public hospitals - Males, Females, Persons
- Infectious and parasitic diseases, 2022/23
- All cancers, 2022/23
- Endocrine, nutritional and metabolic diseases, 2022/23
- Mental health-related conditions, 2022/23
- Mood affective disorders, 2022/23
- Nervous system diseases, 2022/23
- Eye and adnexa diseases, 2022/23
- Ear and mastoid process diseases, 2022/23
- Circulatory system diseases, 2022/23
- Ischaemic heart disease, 2022/23
- Heart failure, 2022/23
- Stroke, 2022/23
- Respiratory system diseases, 2022/23
- Asthma, 2022/23
- Chronic obstructive pulmonary disease (COPD), 2022/23
- Digestive system diseases, 2022/23
- Skin and subcutaneous tissue diseases, 2022/23
- Musculoskeletal system and connective tissue diseases, 2022/23
- Genitourinary system diseases, 2022/23
- Chronic kidney disease, 2022/23
- Pregnancy and childbirth 15 to 44 years (Females only), 2022/23
- Certain conditions originating in the perinatal period (Persons only), 2022/23
- Congenital malformations, deformations and chromosomal abnormalities, 2022/23
- Injury, poisoning and other external causes, 2022/23
Admissions by principal diagnosis of injury or poisoning, by external cause, Public Hospitals - Males, Females, Persons
- Transport crash Injury, 2022/23
- Falls, 2022/23
- Injury due to exposure to inanimate mechanical forces, 2022/23
- Injury due to exposure to animate mechanical forces, 2022/23
- Intentional self-harm, 2022/23
- Assault, 2022/23
- All diagnosis of injury or poisoning, by external cause, 2022/23
Admissions by procedure
- Tonsillectomy - Public, Private, All hospitals, 2022/23
- Myringotomy, 0 to 9 years - Public, Private, All hospitals, 2022/23
- Hysterectomy, females aged 30 to 59 years - Public, Private, All hospitals, 2022/23
- Caesarean section, females aged 15 to 44 years - Public, Private, All hospitals, 2022/23
- Hip fracture - Public, Private, All hospitals, 2022/23
- Fibre optic colonoscopy - Public, Private, All hospitals, 2022/23
- Fibre optic colonoscopy excision - Public, Private, All hospitals, 2022/23
Same-day admissions for renal dialysis, Public hospitals
- Same-day dialysis for kidney disease, 2022/23
Emergency department presentations, by sex
- Male presentations, 2022/23
- Female presentations, 2022/23
- Total presentations, 2022/23
Emergency department presentations, by age and sex
- Male presentations, by broad age group, 2022/23
- Female presentations, by broad age group, 2022/23
- Total presentations, by broad age group, 2022/23
Emergency department presentations, by triage category
- Resuscitation presentations - Total, 2022/23
- Emergency presentations - Total, 2022/23
- Urgent presentations - Total, 2022/23
- Semi-urgent presentations - Total, 2022/23
- Non-urgent presentations - Total, 2022/23
- Total presentations, 2022/23
Emergency department presentations, by principal diagnosis
- Total presentations for certain infectious and parasitic diseases, 2022/23
- Total presentations for mental and behavioural disorders, 2022/23
- Total presentations for diseases of the circulatory system, 2022/23
- Total presentations for diseases of the respiratory system, 2022/23
- Total presentations for diseases of the digestive system, 2022/23
- Total presentations for diseases of the musculoskeletal system and connective tissue, 2022/23
- Total presentations for diseases of the genitourinary system, 2022/23
- Total presentations for factors influencing health status and contact with health services, 2022/23
- Total presentations for other diseases/ conditions, 2022/23
- Total presentations, 2022/23
Emergency department presentations for certain infectious and parasitic diseases, by age
- Male presentations, by broad age group, 2022/23
- Female presentations, by broad age group, 2022/23
- Total presentations, by broad age group, 2022/23
Emergency department presentations for mental and behavioural disorders, by age
- Male presentations, by broad age group, 2022/23
- Female presentations, by broad age group, 2022/23
- Total presentations, by broad age group, 2022/23
Emergency department presentations for diseases of the circulatory system, by age
- Male presentations, by broad age group, 2022/23
- Female presentations, by broad age group, 2022/23
- Total presentations, by broad age group, 2022/23
Emergency department presentations for diseases of the respiratory system, by age
- Male presentations, by broad age group, 2022/23
- Female presentations, by broad age group, 2022/23
- Total presentations, by broad age group, 2022/23
Emergency department presentations for diseases of the digestive system, by age
- Total presentations, by broad age group, 2022/23
Emergency department presentations for diseases of the musculoskeletal system and connective tissue, by age
- Total presentations, by broad age group, 2022/23
Emergency department presentations for diseases of the genitourinary system, by age and sex
- Male presentations, by broad age group, 2022/23
- Female presentations, by broad age group, 2022/23
- Total presentations, by broad age group, 2022/23
Emergency department presentations for injury, poisoning and certain other consequences of external causes, by age and sex
- Male presentations, by broad age group, 2022/23
- Female presentations, by broad age group, 2022/23
- Total presentations, by broad age group, 2022/23
Emergency department presentations for factors influencing health status and contact with health services, by age
- Total presentations, by broad age group, 2022/23
Click hereto access the maps for these atlases.
Click hereto access the graphs for these atlases.
Click hereto access the data for these atlases.
Data release: By Indigenous Area, Primary Health Networks, quintile of Indigenous Relative Socioeconomic Outcomes and Remoteness Areas
Aboriginal & Torres Strait Islander Social Health Atlases of Australia
Fertility
- Aboriginal total fertility rate, 2020-22
Admissions by sex (excluding same-day admissions for renal dialysis)
- Total admissions, Aboriginal males/ females/ persons, 2019/20 to 2022/23
Admissions by age (excluding same-day admissions for renal dialysis)
- Total admissions, Aboriginal people by broad age group, 2019/20 to 2022/23
Admissions by selected principal diagnosis
- Admissions for infectious and parasitic diseases, Aboriginal people, 2019/20 to 2022/23
- Admissions for all cancer, Aboriginal people, 2019/20 to 2022/23
- Admissions for endocrine, nutritional and metabolic diseases, Aboriginal people, 2019/20 to 2022/23
- Admissions for mental health-related conditions, Aboriginal people, 2019/20 to 2022/23
- Admissions for affective (mood) disorders, Aboriginal people, 2019/20 to 2022/23
- Admissions for nervous system diseases, Aboriginal people, 2019/20 to 2022/23
- Admissions for eye and adnexa diseases, Aboriginal people, 2019/20 to 2022/23
- Admissions for ear and mastoid process diseases, Aboriginal people, 2019/20 to 2022/23
- Admissions for circulatory system diseases, Aboriginal people, 2019/20 to 2022/23
- Admissions for ischaemic heart disease, Aboriginal people, 2019/20 to 2022/23
- Admissions for heart failure, Aboriginal people, 2019/20 to 2022/23
- Admissions for respiratory system diseases, Aboriginal people, 2019/20 to 2022/23
- Admissions for asthma, Aboriginal people, 2019/20 to 2022/23
- Admissions for chronic obstructive pulmonary disease (COPD), Aboriginal people, 2019/20 to 2022/23
- Admissions for digestive system diseases, Aboriginal people, 2019/20 to 2022/23
- Admissions for skin and subcutaneous tissue diseases, Aboriginal people, 2019/20 to 2022/23
- Admissions for musculoskeletal system and connective tissue diseases, Aboriginal people, 2019/20 to 2022/23
- Admissions for genitourinary system diseases, Aboriginal people, 2019/20 to 2022/23
- Admissions for chronic kidney disease, Aboriginal people, 2019/20 to 2022/23
- Admissions for pregnancy, childbirth and the puerperium , Aboriginal females aged 15 to 44 years, 2019/20 to 2022/23
- Admissions for congenital malformations, deformations and chromosomal abnormalities, Aboriginal people, 2019/20 to 2022/23
- Admissions for injury, poisoning and other external causes, Aboriginal people, 2019/20 to 2022/23
Admissions by selected principal diagnosis and age
- Admissions for infectious and parasitic diseases, Aboriginal people aged 0 to 14 years, 2019/20 to 2022/23
- Admissions for infectious and parasitic diseases, Aboriginal people aged 15 years and over, 2019/20 to 2022/23
- Admissions for respiratory system diseases, Aboriginal people aged 0 to 14 years, 2019/20 to 2022/23
- Admissions for respiratory system diseases, Aboriginal people aged 15 years and over, 2019/20 to 2022/23
- Admissions for digestive system diseases, Aboriginal people aged 0 to 14 years, 2019/20 to 2022/23
- Admissions for digestive system diseases, Aboriginal people aged 15 years and over, 2019/20 to 2022/23
- Admissions for skin and subcutaneous tissue diseases, Aboriginal people aged 0 to 14 years, 2019/20 to 2022/23
- Admissions for skin and subcutaneous tissue diseases, Aboriginal people aged 15 years and over, 2019/20 to 2022/23
Admissions by principal diagnosis of injury or poisoning, by external cause
- Admissions for transport crash injury, Aboriginal people, 2019/20 to 2022/23
- Admissions for falls, Aboriginal people, 2019/20 to 2022/23
- Admissions for injury due to exposure to inanimate mechanical forces, Aboriginal people, 2019/20 to 2022/23
- Admissions for injury due to exposure to animate mechanical forces, Aboriginal people, 2019/20 to 2022/23
- Admissions for intentional self-harm, Aboriginal people, 2019/20 to 2022/23
- Admissions for assault, Aboriginal people, 2019/20 to 2022/23
- Admissions for total diagnosis of injury or poisoning, by external cause, Aboriginal people, 2019/20 to 2022/23
Same-day hospital admissions for renal dialysis
- Same-day hospital admissions for renal dialysis, Aboriginal people, 2019/20 to 2022/23
Emergency department presentations, by sex
- Emergency department presentations, Aboriginal males/ females/ persons, 2022/23
Emergency department presentations, by age
- Total emergency department presentations, Aboriginal people by broad age group, 2022/23
Emergency department presentations, by triage category
- Resuscitation and emergency presentations, Aboriginal people, 2022/23
- Urgent presentations, Aboriginal people, 2022/23
- Semi-urgent presentations, Aboriginal people, 2022/23
- Non-urgent presentations, Aboriginal people, 2022/23
Emergency department presentations - resuscitation, emergency and urgent, by principal diagnosis
- Resuscitation, emergency and urgent presentations for certain infectious and parasitic diseases, Aboriginal people, 2022/23
- Resuscitation, emergency and urgent presentations for mental and behavioural disorders, Aboriginal people, 2022/23
- Resuscitation, emergency and urgent presentations for diseases of the circulatory system, Aboriginal people, 2022/23
- Resuscitation, emergency and urgent presentations for diseases of the respiratory system, Aboriginal people, 2022/23
- Resuscitation, emergency and urgent presentations for diseases of the digestive system, Aboriginal people, 2022/23
- Resuscitation, emergency and urgent presentations for diseases of the musculoskeletal system and connective tissue, Aboriginal people, 2022/23
- Resuscitation, emergency and urgent presentations for diseases of the genitourinary system, Aboriginal people, 2022/23
- Resuscitation, emergency and urgent presentations for injury, poisoning and certain other consequences of external causes, Aboriginal people, 2022/23
- Resuscitation, emergency and urgent presentations for factors influencing health status and contact with health services, Aboriginal people, 2022/23
Emergency department presentations, by principal diagnosis, by sex
- Total emergency department presentations for certain infectious and parasitic diseases, Aboriginal males/ females/ persons, 2022/23
- Total emergency department presentations for mental and behavioural disorders, Aboriginal males/ females/ persons, 2022/23
- Total emergency department presentations for diseases of the circulatory system, Aboriginal males/ females/ persons, 2022/23
- Total emergency department presentations for diseases of the respiratory system, Aboriginal males/ females/ persons, 2022/23
- Total emergency department presentations for diseases of the digestive system, Aboriginal males/ females/ persons, 2022/23
- Total emergency department presentations for diseases of the musculoskeletal system and connective tissue, Aboriginal males/ females/ persons, 2022/23
- Total emergency department presentations for diseases of the genitourinary system, Aboriginal males/ females/ persons, 2022/23
- Total emergency department presentations for injury, poisoning and certain other consequences of external causes, Aboriginal males/ females/ persons, 2022/23
- Total emergency department presentations for factors influencing health status and contact with health services, Aboriginal males/ females/ persons, 2022/23
Emergency department presentations for mental and behavioural disorders, by age
- Emergency department presentations for mental and behavioural disorders, Aboriginal people by selected broad age groups, 2022/23
Emergency department presentations for diseases of the respiratory system, by age
- Emergency department presentations for diseases of the respiratory system, Aboriginal people by selected broad age groups, 2022/23
Emergency department presentations for diseases of the digestive system, by age
- Emergency department presentations for diseases of the digestive system, Aboriginal people by selected broad age groups, 2022/23
Emergency department presentations for diseases of the musculoskeletal system and connective tissue, by age
- Emergency department presentations for diseases of the musculoskeletal system and connective tissue, Aboriginal people by selected broad age groups, 2022/23
Emergency department presentations for diseases of the genitourinary system, by age
- Emergency department presentations for diseases of the genitourinary system, Aboriginal people by selected broad age groups, 2022/23
Emergency department presentations for injury, poisoning and certain other consequences of external causes, by age and sex
- Emergency department presentations for injury, poisoning and other external causes by selected broad age groups: Aboriginal males/ females/ persons, 2022/23
Emergency department presentations for factors influencing health status and contact with health services, by age
- Emergency department presentations for factors influencing health status and contact with health services, Aboriginal people by selected broad age groups, 2022/23
Click hereto access the maps for these atlases.
Click hereto access the graphs for these atlases.
Click hereto access the data for these atlases.
Data release: Indigenous Status Comparison: Social Health Atlas of Australia
The Indigenous Status Comparison: Social Health Atlas of Australia, presents selected topics and compares indicators between Indigenous and Non-Indigenous populations in Australia. This is available by Indigenous Areas, including total for the Greater Capital City Statistical Areas/Rest of States/NT; and States/Territories.
The topics and indicators in this latest release are listed below.
Fertility
- Indigenous/ Non-Indigenous total fertility rate, 2020-22
Admissions by sex (excluding same-day admissions for renal dialysis)
- Total admissions, Indigenous/ non-Indigenous males, 2019/20 to 2022/23
- Total admissions, Indigenous/ non-Indigenous females, persons, 2019/20 to 2022/23
- Total admissions, Indigenous/ non-Indigenous persons, 2019/20 to 2022/23
Admissions by age (excluding same-day admissions for renal dialysis)
- Total admissions, Indigenous/ non-Indigenous people by broad age group, 2019/20 to 2022/23
Admissions by selected principal diagnosis
- Admissions for infectious and parasitic diseases, Indigenous/ non-Indigenous people, 2019/20 to 2022/23
- Admissions for all cancer, Indigenous/ non-Indigenous people, 2019/20 to 2022/23
- Admissions for endocrine, nutritional and metabolic diseases, Indigenous/ non-Indigenous people, 2019/20 to 2022/23
- Admissions for mental health-related conditions, Indigenous/ non-Indigenous people, 2019/20 to 2022/23
- Admissions for affective (mood) disorders, Indigenous/ non-Indigenous people, 2019/20 to 2022/23
- Admissions for nervous system diseases, Indigenous/ non-Indigenous people, 2019/20 to 2022/23
- Admissions for eye and adnexa diseases, Indigenous/ non-Indigenous people, 2019/20 to 2022/23
- Admissions for ear and mastoid process diseases, Indigenous/ non-Indigenous people, 2019/20 to 2022/23
- Admissions for circulatory system diseases, Indigenous/ non-Indigenous people, 2019/20 to 2022/23
- Admissions for ischaemic heart disease, Indigenous/ non-Indigenous people, 2019/20 to 2022/23
- Admissions for heart failure, Indigenous/ non-Indigenous people, 2019/20 to 2022/23
- Admissions for respiratory system diseases, Indigenous/ non-Indigenous people, 2019/20 to 2022/23
- Admissions for asthma, Indigenous/ non-Indigenous people, 2019/20 to 2022/23
- Admissions for chronic obstructive pulmonary disease (COPD), Indigenous/ non-Indigenous people, 2019/20 to 2022/23
- Admissions for digestive system diseases, Indigenous/ non-Indigenous people, 2019/20 to 2022/23
- Admissions for skin and subcutaneous tissue diseases, Indigenous/ non-Indigenous people, 2019/20 to 2022/23
- Admissions for musculoskeletal system and connective tissue diseases, Indigenous/ non-Indigenous people, 2019/20 to 2022/23
- Admissions for genitourinary system diseases, Indigenous/ non-Indigenous people, 2019/20 to 2022/23
- Admissions for chronic kidney disease, Indigenous/ non-Indigenous people, 2019/20 to 2022/23
- Admissions for pregnancy, childbirth and the puerperium , Indigenous/ non-Indigenous females aged 15 to 44 years, 2019/20 to 2022/23
- Admissions for congenital malformations, deformations and chromosomal abnormalities, Indigenous/ non-Indigenous people, 2019/20 to 2022/23
- Admissions for injury, poisoning and other external causes, Indigenous/ non-Indigenous people, 2019/20 to 2022/23
Admissions by selected principal diagnosis and age
- Admissions for infectious and parasitic diseases, Indigenous/ non-Indigenous people aged 0 to 14 years, 2019/20 to 2022/23
- Admissions for infectious and parasitic diseases, Indigenous/ non-Indigenous people aged 15 years and over, 2019/20 to 2022/23
- Admissions for respiratory system diseases, Indigenous/ non-Indigenous people aged 0 to 14 years, 2019/20 to 2022/23
- Admissions for respiratory system diseases, Indigenous/ non-Indigenous people aged 15 years and over, 2019/20 to 2022/23
- Admissions for digestive system diseases, Indigenous/ non-Indigenous people aged 0 to 14 years, 2019/20 to 2022/23
- Admissions for digestive system diseases, Indigenous/ non-Indigenous people aged 15 years and over, 2019/20 to 2022/23
- Admissions for skin and subcutaneous tissue diseases, Indigenous/ non-Indigenous people aged 0 to 14 years, 2019/20 to 2022/23
- Admissions for skin and subcutaneous tissue diseases, Indigenous/ non-Indigenous people aged 15 years and over, 2019/20 to 2022/23
Admissions by principal diagnosis of injury or poisoning, by external cause
- Admissions for transport crash injury, Indigenous/ non-Indigenous people, 2019/20 to 2022/23
- Admissions for falls, Indigenous/ non-Indigenous people, 2019/20 to 2022/23
- Admissions for injury due to exposure to inanimate mechanical forces, Indigenous/ non-Indigenous people, 2019/20 to 2022/23
- Admissions for injury due to exposure to animate mechanical forces, Indigenous/ non-Indigenous people, 2019/20 to 2022/23
- Admissions for intentional self-harm, Indigenous/ non-Indigenous people, 2019/20 to 2022/23
- Admissions for assault, Indigenous/ non-Indigenous people, 2019/20 to 2022/23
- Admissions for total diagnosis of injury or poisoning, by external cause, Indigenous/ non-Indigenous people, 2019/20 to 2022/23
Same-day hospital admissions for renal dialysis
- Same-day hospital admissions for renal dialysis, Indigenous/ non-Indigenous people, 2019/20 to 2022/23
Emergency department presentations, by sex
- Emergency department presentations, Indigenous/ non-Indigenous males, 2022/23
- Emergency department presentations, Indigenous/ non-Indigenous females, 2022/23
- Emergency department presentations, Indigenous/ non-Indigenous persons, 2022/23
Emergency department presentations, by age
- Total emergency department presentations, Indigenous/ non-Indigenous people by broad age group, 2022/23
Emergency department presentations, by triage category
- Resuscitation and emergency presentations, Indigenous/ non-Indigenous people, 2022/23
- Urgent presentations, Indigenous/ non-Indigenous people, 2022/23
- Semi-urgent presentations, Indigenous/ non-Indigenous people, 2022/23
- Non-urgent presentations, Indigenous/ non-Indigenous people, 2022/23
Emergency department presentations - resuscitation, emergency and urgent, by principal diagnosis
- Resuscitation, emergency and urgent presentations for certain infectious and parasitic diseases, Indigenous/ non-Indigenous people, 2022/23
- Resuscitation, emergency and urgent presentations for mental and behavioural disorders, Indigenous/ non-Indigenous people, 2022/23
- Resuscitation, emergency and urgent presentations for diseases of the circulatory system, Indigenous/ non-Indigenous people, 2022/23
- Resuscitation, emergency and urgent presentations for diseases of the respiratory system, Indigenous/ non-Indigenous people, 2022/23
- Resuscitation, emergency and urgent presentations for diseases of the digestive system, Indigenous/ non-Indigenous people, 2022/23
- Resuscitation, emergency and urgent presentations for diseases of the musculoskeletal system and connective tissue, Indigenous/ non-Indigenous people, 2022/23
- Resuscitation, emergency and urgent presentations for diseases of the genitourinary system, Indigenous/ non-Indigenous people, 2022/23
- Resuscitation, emergency and urgent presentations for injury, poisoning and certain other consequences of external causes, Indigenous/ non-Indigenous people, 2022/23
- Resuscitation, emergency and urgent presentations for factors influencing health status and contact with health services, Indigenous/ non-Indigenous people, 2022/23
Emergency department presentations, by principal diagnosis, by sex
- Total emergency department presentations for certain infectious and parasitic diseases, Indigenous/ non-Indigenous males, females, persons, 2022/23
- Total emergency department presentations for mental and behavioural disorders, Indigenous/ non-Indigenous males, females, persons, 2022/23
- Total emergency department presentations for diseases of the circulatory system, Indigenous/ non-Indigenous males, females, persons, 2022/23
- Total emergency department presentations for diseases of the respiratory system, Indigenous/ non-Indigenous males, females, persons, 2022/23
- Total emergency department presentations for diseases of the digestive system, Indigenous/ non-Indigenous males, females, persons, 2022/23
- Total emergency department presentations for diseases of the musculoskeletal system and connective tissue, Indigenous/ non-Indigenous males, females, persons, 2022/23
- Total emergency department presentations for diseases of the genitourinary system, Indigenous/ non-Indigenous males, females, persons, 2022/23
- Total emergency department presentations for injury, poisoning and certain other consequences of external causes, Indigenous/ non-Indigenous males, females, persons, 2022/23
- Total emergency department presentations for factors influencing health status and contact with health services, Indigenous/ non-Indigenous males, females, persons, 2022/23
Emergency department presentations for mental and behavioural disorders, by age
- Emergency department presentations for mental and behavioural disorders, Indigenous/ non-Indigenous people by selected broad age groups, 2022/23
Emergency department presentations for diseases of the respiratory system, by age
- Emergency department presentations for diseases of the respiratory system, Indigenous/ non-Indigenous people by selected broad age groups, 2022/23
Emergency department presentations for diseases of the digestive system, by age
- Emergency department presentations for diseases of the digestive system, Indigenous/ non-Indigenous people by selected broad age groups, 2022/23
Emergency department presentations for diseases of the musculoskeletal system and connective tissue, by age
- Emergency department presentations for diseases of the musculoskeletal system and connective tissue, Indigenous/ non-Indigenous people by selected broad age groups, 2022/23
Emergency department presentations for diseases of the genitourinary system, by age
- Emergency department presentations for diseases of the genitourinary system, Indigenous/ non-Indigenous people by selected broad age groups, 2022/23
Emergency department presentations for injury, poisoning and certain other consequences of external causes, by age and sex
- Emergency department presentations for injury, poisoning and other external causes by selected broad age groups: Indigenous/ non-Indigenous males, 2022/23
- Emergency department presentations for injury, poisoning and other external causes by selected broad age groups: Indigenous/ non-Indigenous females, 2022/23
- Emergency department presentations for injury, poisoning and other external causes by selected broad age groups: Indigenous/ non-Indigenous persons, 2022/23
Emergency department presentations for factors influencing health status and contact with health services, by age
- Emergency department presentations for factors influencing health status and contact with health services, Indigenous/ non-Indigenous people by selected broad age groups, 2022/23
Click hereto access the maps for these atlases.
Click hereto access the graphs for these atlases.
Click hereto access the data for these atlases.
Data release: 30 June 2025
Data release: By Population Health Area, Local Government Area, Primary Health Network, quintile of socioeconomic disadvantage of area (including within Primary Health Networks) and Remoteness Area
Social Health Atlases of Australia
Education
- Participation in vocational education and training - Aboriginal population, 2023
- Participation in vocational education and training - Total population, 2023
- Subject completion rates in vocational education and training - Government-funded hours, 2023
- Subject completion rates in vocational education and training - Private-funded hours, 2023
- Subject completion rates in vocational education and training - Total student hours, 2023
- Subject completion rates in vocational education and training - Aboriginal student hours, 2023
Screening programs
- Breast screening participation, females aged 50 to 74 years, 2021 and 2022
- Breast screening outcomes - cancer, females aged 50 to 74 years, 2021 and 2022
Click hereto access the maps for these atlases.
Click hereto access the graphs for these atlases.
Click hereto access the data for these atlases.
Data release: By Indigenous Area, Primary Health Networks, quintile of Indigenous Relative Socioeconomic Outcomes and Remoteness Areas
Aboriginal & Torres Strait Islander Social Health Atlases of Australia
Education
- Participation of Aboriginal people in vocational education and training, 2023
- Subject completion rates in vocational education and training, Aboriginal students, 2023
Click hereto access the maps for these atlases.
Click hereto access the graphs for these atlases.
Click hereto access the data for these atlases.
Data release: Indigenous Status Comparison: Social Health Atlas of Australia
The Indigenous Status Comparison: Social Health Atlas of Australia, presents selected topics and compares indicators between Indigenous and Non-Indigenous populations in Australia. This is available by Indigenous Areas, including total for the Greater Capital City Statistical Areas/Rest of States/NT; and States/Territories.
The topics and indicators in this latest release are listed below.
Education
- Participation of Indigenous/ Non-Indigenous people in vocational education and training, 2023
- Subject completion rates in vocational education and training, Indigenous/ Non-Indigenous students, 2023
Click hereto access the maps for these atlases.
Click hereto access the graphs for these atlases.
Click hereto access the data for these atlases.
Data release: 30 April 2025
Data release: By Population Health Area, Local Government Area, Primary Health Network, quintile of socioeconomic disadvantage of area and Remoteness Area
Social Health Atlases of Australia
Prevalence of selected health risk factors (modelled estimates) - Population Health Area, Local Government Area and Primary Health Network
- Estimated number of males aged 15 years and over who currently use an electronic cigarette (e-cigarette) or vaping device, 2022
- Estimated number of females aged 15 years and over who currently use an electronic cigarette (e-cigarette) or vaping device, 2022
- Estimated number of persons aged 15 years and over who currently use an electronic cigarette (e-cigarette) or vaping device, 2022
Prevalence of selected health risk factors (direct estimates) - Quintile of socioeconomic disadvantage of area and Remoteness Area
- Estimated number of persons aged 15 years and over who currently use an electronic cigarette (e-cigarette) or vaping device, 2022
Click hereto access the maps for these atlases.
Click hereto access the graphs for these atlases.
Click hereto access the data for these atlases.
Data release: 31 March 2025
Data release: By Population Health Area, Local Government Area, Primary Health Network, quintile of socioeconomic disadvantage of area (including within Primary Health Networks) and Remoteness Area
Social Health Atlases of Australia
Child and youth health
- Children fully immunised at 1 year of age, 2023
- Children fully immunised at 2 years of age, 2023
- Children fully immunised at 5 years of age, 2023
- Human papillomavirus (HPV) 1 dose or more vaccine coverage: females aged 15 years in mid-2023
- Human papillomavirus (HPV) 1 dose or more vaccine coverage: males aged 15 years in mid-2023
Screening programs
- Cervical screening participation, females aged 25 to 74 years, 2018 to 2022
- Cervical screening outcomes - abnormality, females aged 25 to 74 years, 2018 to 2022
Health workforce (LGA and PHN only)
- General Medical Practitioners, 2023
- Hospital Practitioners non-specialist, 2023
- Specialist Practitioners, 2023
- Specialist Practitioners in training, 2023
- Total Medical Practitioners, 2023
- Registered Nurses only, 2023
- Registered Nurses who are also Midwives, 2023
- Total Registered Nurses, 2023
- Enrolled Nurses, 2023
- Midwives (may also be a Registered Nurse or Enrolled Nurse), 2023
- Total Nurses (Registered Nurses, Enrolled Nurses or Midwives, each person only counted once), 2023
- Dentists, 2023
- Total Dental Practitioners (includes Dentists, Oral health therapists, Dental hygienists, Dental therapists and Dental prosthetists), 2023
Click hereto access the maps for these atlases.
Click hereto access the graphs for these atlases.
Click hereto access the data for these atlases.
Data release: By Indigenous Area, Primary Health Networks, quintile of Indigenous Relative Socioeconomic Outcomes and Remoteness Areas
Aboriginal & Torres Strait Islander Social Health Atlases of Australia
Immunisation for children and young people
- Aboriginal children fully immunised at 1 year of age, 2023
- Aboriginal children fully immunised at 2 years of age, 2023
- Aboriginal children fully immunised at 5 years of age, 2023
- Human papillomavirus (HPV) 1 dose or more vaccine coverage: Aboriginal females aged 15 years in mid-2023
- Human papillomavirus (HPV) 1 dose or more vaccine coverage: Aboriginal males aged 15 years in mid-2023
Click hereto access the maps for these atlases.
Click hereto access the graphs for these atlases.
Click hereto access the data for these atlases.
Data release: Indigenous Status Comparison: Social Health Atlas of Australia
The Indigenous Status Comparison: Social Health Atlas of Australia, presents selected topics and compares indicators between Indigenous and Non-Indigenous populations in Australia. This is available by Indigenous Areas, including total for the Greater Capital City Statistical Areas/Rest of States/NT; and States/Territories.
The topics and indicators in this latest release are listed below.
Immunisation for children and young people
- Indigenous/ Non-Indigenous children fully immunised at 1 year of age, 2023
- Indigenous/ Non-Indigenous children fully immunised at 2 years of age, 2023
- Indigenous/ Non-Indigenous children fully immunised at 5 years of age, 2023
- Human papillomavirus (HPV) 1 dose or more vaccine coverage: Indigenous/ Non-Indigenous females aged 15 years in mid-2023
- Human papillomavirus (HPV) 1 dose or more vaccine coverage: Indigenous/ Non-Indigenous males aged 15 years in mid-2023
Potential years of life lost by selected cause - Errata (Indigenous Area data workbook only)
Incorrect data were published in September 2024 for the potential years of life lost by selected cause indicators within the Indigenous Area data workbook. These indicators have been re-released in March 2025 with the correct data.
Click hereto access the maps for these atlases.
Click hereto access the graphs for these atlases.
Click hereto access the data for these atlases.
2024
Data release: 18 December 2024
Data release: By Population Health Area, Local Government Area, Primary Health Network, quintile of socioeconomic disadvantage of area (including within Primary Health Networks) and Remoteness Area
Social Health Atlases of Australia
Age distribution - estimated resident population (ERP)
- Age distribution - 5 years age groups, and broad age groups: Males, Females, Persons (ERP), 2023
Fertility
- Total fertility rate; 2023
Education
- Preschool enrolments: children aged 4 years, 5 years, and 4 or 5 years, 2023
- Preschool attendance: children aged 4 years, 5 years, and 4 or 5 years, 2023
Prevalence of 12-month mental health disorders (modelled estimates) (excluding Local Government Area)
- Estimated male, female, total population aged 16 to 85 years, living in private dwellings, with a 12-month Affective disorder, 2020-2022
- Estimated male, female, total population aged 16 to 85 years, living in private dwellings, with a 12-month Anxiety disorder, 2020-2022
- Estimated male, female, total population aged 16 to 85 years, living in private dwellings, with a 12-month Substance Use disorder, 2020-2022
- Estimated male, female, total population aged 16 to 85 years, living in private dwellings, with any 12-month mental health disorder, 2020-2022
- Estimated male, female, total population aged 16 to 85 years, living in private dwellings, with any 12-month mental health disorder by mild/ moderate/ severe severity, 2020-2022
- Estimated male, female, total population aged 16 to 85 years, living in private dwellings, with a comorbidity of any 12-month mental health disorder and a physical condition, 2020-2022
Self-assessed health (modelled estimates)
- Estimated population, aged 15 years and over, with fair or poor self-assessed health, 2022
Prevalence of selected health risk factors (modelled estimates)
- Estimated male, female, total population aged 18 years and over with high or very high psychological distress, based on the Kessler 10 Scale (K10), 2022
- Estimated population aged 18 years and over who had high blood pressure, 2022
- Estimated male, female, total population aged 18 years and over who were overweight (but not obese), 2022
- Estimated male, female, total population aged 18 years and over who were obese, 2022
- Estimated male, female, total population aged 18 years and over with a waist measurement indicating an increased/ substantially increased risk of developing chronic diseases, 2022
- Estimated male, female, total population aged 18 years and over who were current smokers, 2022
- Estimated male, female, total population aged 15 years and over who consumed 5 or more standard alcoholic drinks on any day in the last 12 months (at least monthly), 2022
- Estimated population aged 18 years and over with adequate fruit intake, 2022
- Estimated population, aged 15 years and over, who did not meet 2014 physical activity guidelines (physical activity excluding workplace activity), 2022
- Estimated male, female, total population aged 2-17 years who were overweight (but not obese), 2022
- Estimated male, female, total population aged 2-17 years who were obese, 2022
Click hereto access the maps for these atlases.
Click hereto access the graphs for these atlases.
Click hereto access the data for these atlases.
Data release: By Indigenous Area, Primary Health Networks, quintile of Indigenous Relative Socioeconomic Outcomes and Remoteness Areas
Aboriginal & Torres Strait Islander Social Health Atlases of Australia
Education
- Preschool enrolments: Aboriginal children aged 4 years, 5 years, and 4 or 5 years, 2023
- Preschool attendance: Aboriginal children aged 4 years, 5 years, and 4 or 5 years, 2023
Click hereto access the maps for these atlases.
Click hereto access the graphs for these atlases.
Click hereto access the data for these atlases.
Data release: Indigenous Status Comparison: Social Health Atlas of Australia
The Indigenous Status Comparison: Social Health Atlas of Australia, presents selected topics and compares indicators between Indigenous and Non-Indigenous populations in Australia. This is available by Indigenous Areas, including total for the Greater Capital City Statistical Areas/Rest of States/NT; and States/Territories.
The topics and indicators in this latest release are listed below.
Education
- Preschool enrolments: Indigenous/ Non-Indigenous children aged 4 years, 5 years, and 4 or 5 years, 2023
- Preschool attendance: Indigenous/ Non-Indigenous children aged 4 years, 5 years, and 4 or 5 years, 2023
Click hereto access the maps for these atlases.
Click hereto access the graphs for these atlases.
Click hereto access the data for these atlases.
Presentation: 18 October 2024
Professor John Glover, Director of PHIDU, presented “30 years of mapping social and health inequality: have we seen changes?" as part of Torrens University's 2024 Research Seminar Series Program. Professor Glover will discuss three topics, two of which have come to be seen as even bigger challenges in recent years and one which has always been ‘acknowledged’ as a major inequality, but is not a focus of government action. The topics are overweight and obesity, mental health and premature mortality. He will show examples from the Social Health Atlas of Australia, with data dating back to the mid- to late-1980s, to show how many spatial patterns are engrained in our cities, and that despite overall improvements in many indicators of the social determinants of health equity and of health outcomes, the equity gap is frequently widening.
The PowerPoint slides are available here and the recording of the presentation is available here.
Data release: 30 September 2024
Data release: By Population Health Area, Local Government Area, Primary Health Network, quintile of socioeconomic disadvantage of area (including within Primary Health Networks) and Remoteness Area
Social Health Atlases of Australia
Population projections
- Male, female and total population by broad age groups: 0-14, 15-24, 25-44, 45-64, 65+, 70+, 75+, 85+ years; 2025 and 2030 projected population
Private health insurance
- Private health insurance, 2020-21
Child and youth health
- Infant mortality, 2018 to 2022
- Youth mortality, 2018 to 2022
Median age at death by sex
- Median age at death of males, females, persons, 2018 to 2022
Premature mortality by sex
- Deaths of males, females, persons aged 0 to 74 years, 2018 to 2022
Premature mortality by selected cause
- Deaths from cancer, people aged 0 to 74 years, 2018 to 2022
- Deaths from colorectal cancer, people aged 0 to 74 years, 2018 to 2022
- Deaths from lung cancer, people aged 0 to 74 years, 2018 to 2022
- Deaths from breast cancer, females aged 0 to 74 years, 2018 to 2022
- Deaths from pancreatic cancer, people aged 0 to 74 years, 2018 to 2022
- Deaths from lymphoid, haematopoietic and related tissue cancer, people aged 0 to 74 years, 2018 to 2022
- Deaths from diabetic, people aged 0 to 74 years, 2018 to 2022
- Deaths from circulatory system diseases, people aged 0 to 74 years, 2018 to 2022
- Deaths from ischaemic heart disease, people aged 0 to 74 years, 2018 to 2022
- Deaths from cerebrovascular diseases, people aged 0 to 74 years, 2018 to 2022
- Deaths from respiratory system diseases, people aged 0 to 74 years, 2018 to 2022
- Deaths from chronic obstructive pulmonary disease, people aged 0 to 74 years, 2018 to 2022
- Deaths from cirrhosis and other diseases of the liver, people aged 0 to 74 years, 2018 to 2022
- Deaths from external causes, people aged 0 to 74 years, 2018 to 2022
- Deaths from road traffic injuries, people aged 0 to 74 years, 2018 to 2022
- Deaths from suicide and self-inflicted injuries, people aged 0 to 74 years, 0 to 44 years and 0 to 74 years, 2018 to 2022
- Deaths from accidental poisoning, people aged 0 to 74 years, 2018 to 2022
- Deaths from COVID-19, people aged 0 to 74 years, 2018 to 2022 (Quintiles and Remoteness Areas only)
Avoidable mortality by sex
- Deaths from all avoidable causes, males, females, persons aged 0 to 74 years, 2018 to 2022
Avoidable mortality by selected cause
- Avoidable deaths from cancer, people aged 0 to 74 years, 2018 to 2022
- Avoidable deaths from colorectal cancer, people aged 0 to 74 years, 2018 to 2022
- Avoidable deaths from breast cancer, females aged 0 to 74 years, 2018 to 2022
- Avoidable deaths from diabetes, people aged 0 to 74 years, 2018 to 2022
- Avoidable deaths from circulatory system diseases, people aged 0 to 74 years, 2018 to 2022
- Avoidable deaths from ischaemic heart disease, people aged 0 to 74 years, 2018 to 2022
- Avoidable deaths from cerebrovascular diseases, people aged 0 to 74 years, 2018 to 2022
- Avoidable deaths from respiratory system diseases, people aged 0 to 74 years, 2018 to 2022
- Avoidable deaths from chronic obstructive pulmonary disease, people aged 0 to 74 years, 2018 to 2022
- Avoidable deaths from selected external causes of mortality (Falls; Fires, burns; Suicide and self-inflicted injuries; etc.), people aged 0 to 74 years, 2018 to 2022
- Avoidable deaths from suicide and self-inflicted injuries, people aged 0 to 74 years, 0 to 44 years, 45 to 74 years, 2018 to 2022
- Avoidable deaths from other external causes of mortality (Transport accidents; Accidental drowning and submersion; etc.), people aged 0 to 74 years, 2018 to 2022
- Avoidable deaths from transport accidents, people aged 0 to 74 years, 2018 to 2022
Potential years of life lost, by sex
- Potential years of life lost males, females, persons, 2018 to 2022
Potential years of life lost, by age and sex
- Potential years of life lost, males by broad age group (0 to 14, 15 to 24, 25 to 44, 45 to 64 and 65 to 74 years), 2018 to 2022
- Potential years of life lost, females by broad age group (0 to 14, 15 to 24, 25 to 44, 45 to 64 and 65 to 74 years), 2018 to 2022
- Potential years of life lost, persons by broad age group (0 to 14, 15 to 24, 25 to 44, 45 to 64 and 65 to 74 years), 2018 to 2022
Potential years of life lost, by selected cause
- Potential years of life lost from cancer (deaths before 75 years of age), 2018 to 2022
- Potential years of life lost from colorectal cancer (deaths before 75 years of age), 2018 to 2022
- Potential years of life lost from lung cancer (deaths before 75 years of age), 2018 to 2022
- Potential years of life lost from breast cancer (deaths before 75 years of age), 2018 to 2022
- Potential years of life lost from diabetes (deaths before 75 years of age), 2018 to 2022
- Potential years of life lost from circulatory system diseases (deaths before 75 years of age), 2018 to 2022
- Potential years of life lost from ischaemic heart disease (deaths before 75 years of age), 2018 to 2022
- Potential years of life lost from cerebrovascular diseases (deaths before 75 years of age), 2018 to 2022
- Potential years of life lost from respiratory system diseases (deaths before 75 years of age), 2018 to 2022
- Potential years of life lost from chronic obstructive pulmonary disease (deaths before 75 years of age), 2018 to 2022
- Potential years of life lost from external causes (deaths before 75 years of age), 2018 to 2022
- Potential years of life lost from road traffic injuries (deaths before 75 years of age), 2018 to 2022
- Potential years of life lost from suicide and self-inflicted injuries (deaths before 75 years of age), 2018 to 2022
Community Mental Health Care Service patients, by sex
- Community mental health care patients, males, females, persons, 2020/21
Community Mental Health Care Service contacts, by principal diagnosis
- Schizophrenia, schizotypal and delusional disorders, 2020/21
- Bipolar affective disorders, 2020/21
- Depressive episode, 2020/21
- Other anxiety disorders, 2020/21
- Reaction to severe stress and adjustment disorders, 2020/21
- Specific personality disorders, 2020/21
- All other codes (not specified), 2020/21
- Total Community Mental Health Care Service contacts, 2020/21
Click hereto access the maps for these atlases.
Click hereto access the graphs for these atlases.
Click hereto access the data for these atlases.
Data release: By Indigenous Area, Primary Health Networks, quintile of Indigenous Relative Socioeconomic Outcomes and Remoteness Areas
Aboriginal & Torres Strait Islander Social Health Atlases of Australia
Median age at death
- Median age at death of Aboriginal males, females, persons, 2018 to 2022
Premature mortality by age and sex
- Deaths of Aboriginal males aged 0 to 54 years, 2018 to 2022
- Deaths of Aboriginal females aged 0 to 54 years, 2018 to 2022
- Deaths of Aboriginal persons aged 0 to 54 years, 2018 to 2022
- Deaths of Aboriginal males aged 0 to 64 years, 2018 to 2022
- Deaths of Aboriginal females aged 0 to 64 years, 2018 to 2022
- Deaths of Aboriginal persons aged 0 to 64 years, 2018 to 2022
- Deaths of Aboriginal males aged 0 to 74 years, 2018 to 2022
- Deaths of Aboriginal females aged 0 to 74 years, 2018 to 2022
- Deaths of Aboriginal persons aged 0 to 74 years, 2018 to 2022
Premature mortality by selected cause
- Deaths from cancers, Aboriginal people: 0 to 54 years, 2018 to 2022
- Deaths from circulatory system diseases, Aboriginal people: 0 to 54 years, 2018 to 2022
- Deaths from external causes, Aboriginal people: 0 to 54 years, 2018 to 2022
- Deaths from cancers, Aboriginal people: 0 to 64 years, 2018 to 2022
- Deaths from circulatory system diseases, Aboriginal people: 0 to 64 years, 2018 to 2022
- Deaths from respiratory system diseases, Aboriginal people: 0 to 64 years, 2018 to 2022
- Deaths from external causes, Aboriginal people: 0 to 64 years, 2018 to 2022
- Deaths from cancers, Aboriginal people: 0 to 74 years, 2018 to 2022
- Deaths from lung cancers, Aboriginal people: 0 to 74 years, 2018 to 2022
- Deaths from diabetes, Aboriginal people: 0 to 74 years, 2018 to 2022
- Deaths from circulatory system diseases, Aboriginal people: 0 to 74 years, 2018 to 2022
- Deaths from ischaemic heart disease, Aboriginal people: 0 to 74 years, 2018 to 2022
- Deaths from respiratory system diseases, Aboriginal people: 0 to 74 years, 2018 to 2022
- Deaths from chronic obstructive pulmonary disease (COPD), Aboriginal people: 0 to 74 years, 2018 to 2022
- Deaths from cirrhosis and other diseases of the live, Aboriginal people: 0 to 74 years, 2018 to 2022
- Deaths from external causes, Aboriginal people: 0 to 74 years, 2018 to 2022
- Deaths from road traffic injuries, Aboriginal people: 0 to 74 years, 2018 to 2022
- Deaths from suicide and self-inflicted injuries, Aboriginal people: 0 to 74 years, 2018 to 2022
- Deaths from accidental poisoning, Aboriginal people: 0 to 74 years, 2018 to 2022
Avoidable mortality by sex
- Deaths from all avoidable causes, Aboriginal males, females, persons aged 0 to 74 years, 2018 to 2022
Avoidable mortality by selected cause
- Avoidable deaths from cancer, Aboriginal people aged 0 to 74 years, 2018 to 2022
- Avoidable deaths from diabetes, Aboriginal people aged 0 to 74 years, 2018 to 2022
- Avoidable deaths from circulatory system diseases, Aboriginal people aged 0 to 74 years, 2018 to 2022
- Avoidable deaths from ischaemic heart disease, Aboriginal people aged 0 to 74 years, 2018 to 2022
- Avoidable deaths from respiratory system diseases, Aboriginal people aged 0 to 74 years, 2018 to 2022
- Avoidable deaths from chronic obstructive pulmonary disease (COPD), Aboriginal people aged 0 to 74 years, 2018 to 2022
- Avoidable deaths from selected external causes, Aboriginal people aged 0 to 74 years, 2018 to 2022
- Avoidable deaths from suicide and self-inflicted injuries, Aboriginal people aged 0 to 74 years, 2018 to 2022
- Avoidable deaths from other external causes, Aboriginal people aged 0 to 74 years, 2018 to 2022
- Avoidable deaths from transport accidents, Aboriginal people aged 0 to 74 years, 2018 to 2022
Potential years of life lost by age and sex
- Potential years of life lost, Aboriginal males, females, persons aged 0 to 54 years, 2018 to 2022
- Potential years of life lost, Aboriginal males, females, persons aged 0 to 64 years, 2018 to 2022
- Potential years of life lost, Aboriginal males, females, persons aged 0 to 74 years, 2018 to 2022
Potential years of life lost by selected cause
- Potential years of life lost from cancer (deaths of Aboriginal people before 75 years of age), 2018 to 2022
- Potential years of life lost from lung cancer (deaths of Aboriginal people before 75 years of age), 2018 to 2022
- Potential years of life lost from diabetes (deaths of Aboriginal people before 75 years of age), 2018 to 2022
- Potential years of life lost from circulatory system diseases (deaths of Aboriginal people before 75 years of age), 2018 to 2022
- Potential years of life lost from ischaemic heart disease (deaths of Aboriginal people before 75 years of age), 2018 to 2022
- Potential years of life lost from respiratory system diseases (deaths of Aboriginal people before 75 years of age), 2018 to 2022
- Potential years of life lost from chronic obstructive pulmonary disease (COPD) (deaths of Aboriginal people before 75 years of age), 2018 to 2022
- Potential years of life lost from external causes (deaths of Aboriginal people before 75 years of age), 2018 to 2022
- Potential years of life lost from road traffic injuries (deaths of Aboriginal people before 75 years of age), 2018 to 2022
- Potential years of life lost from suicide and self-inflicted injuries (deaths of Aboriginal people before 75 years of age), 2018 to 2022
Emergency department presentations, by sex
- Male emergency department presentations, Aboriginal males, 2020/21
- Female emergency department presentations, Aboriginal females, 2020/21
- Total emergency department presentations, Aboriginal persons, 2020/21
Emergency department presentations, by age
- Total emergency department presentations, Aboriginal people aged 0-14, 15-24, 25-44, 45-64, 65+ year, 2020/21
Emergency department presentations, by triage category
- Resuscitation and emergency presentations, Aboriginal people, 2020/21
- Urgent presentations, Aboriginal people, 2020/21
- Semi-urgent presentations, Aboriginal people, 2020/21
- Non-urgent presentations, Aboriginal people, 2020/21
Emergency department presentations - resuscitation, emergency and urgent, by principal diagnosis
- Resuscitation, emergency and urgent presentations for certain infectious and parasitic diseases, Aboriginal people, 2020/21
- Resuscitation, emergency and urgent presentations for mental and behavioural disorders, Aboriginal people, 2020/21
- Resuscitation, emergency and urgent presentations for diseases of the circulatory system, Aboriginal people, 2020/21
- Resuscitation, emergency and urgent presentations for diseases of the respiratory system, Aboriginal people, 2020/21
- Resuscitation, emergency and urgent presentations for diseases of the digestive system, Aboriginal people, 2020/21
- Resuscitation, emergency and urgent presentations for diseases of the musculoskeletal system and connective tissue, Aboriginal people, 2020/21
- Resuscitation, emergency and urgent presentations for diseases of the genitourinary system, Aboriginal people, 2020/21
- Resuscitation, emergency and urgent presentations for injury, poisoning and certain other consequences of external causes, Aboriginal people, 2020/21
- Resuscitation, emergency and urgent presentations or factors influencing health status and contact with health services, Aboriginal people, 2020/21
Emergency department presentations, by principal diagnosis, by sex
- Total emergency department presentations for certain infectious and parasitic diseases, Aboriginal males, females, persons, 2020/21
- Total emergency department presentations for mental and behavioural disorders, Aboriginal males, females, persons, 2020/21
- Total emergency department presentations for diseases of the circulatory system, Aboriginal males, females, persons, 2020/21
- Total emergency department presentations for diseases of the respiratory system, Aboriginal males, females, persons, 2020/21
- Total emergency department presentations for diseases of the digestive system, Aboriginal males, females, persons, 2020/21
- Total emergency department presentations for diseases of the musculoskeletal system and connective tissue, Aboriginal males, females, persons2020/21
- Total emergency department presentations for diseases of the genitourinary system, Aboriginal males, females, persons, 2020/21
- Total emergency department presentations for injury, poisoning and certain other consequences of external causes, Aboriginal males, females, persons,2020/21
- Total emergency department presentations for factors influencing health status and contact with health services, Aboriginal males, females, persons,2020/21
Emergency department presentations for mental and behavioural disorders, by age
- Emergency department presentations for mental and behavioural disorders, Aboriginal people aged 15-24, 25-44, 45-64 years, 2020/21
Emergency department presentations for disease of the respiratory system, by age
- Emergency department presentations for diseases of the respiratory system, Aboriginal people aged 0-14, 15-24, 25-44, 45-64 years, 2020/21
Emergency department presentations for diseases of the digestive system, by age
- Emergency department presentations for diseases of the digestive system, Aboriginal people aged 0-14, 15-24, 25-44, 45-64 years, 2020/21
Emergency department presentations for diseases of the musculoskeletal system and connective tissue, by age
- Emergency department presentations for diseases of the musculoskeletal system and connective tissue, Aboriginal people aged 0-14, 15-24, 25-44, 45-64 years, 2020/21
Emergency department presentations for diseases of the genitourinary system, by age
- Emergency department presentations for diseases of the genitourinary system, Aboriginal people aged 15-24, 25-44, 45-64 years, 2020/21
Emergency department presentations for injury, poisoning and certain other consequences of external causes, by age and sex
- Emergency department presentations for injury, poisoning and other external causes, Aboriginal males, by broad age group (0-14, 15-24, 25-44, 45-64 years), 2020/21
- Emergency department presentations for injury, poisoning and other external causes, Aboriginal females, by broad age group (0-14, 15-24, 25-44, 45-64 years), 2020/21
- Emergency department presentations for injury, poisoning and other external causes, Aboriginal persons, by broad age group (0-14, 15-24, 25-44, 45-64 years), 2020/21
Emergency department presentations for factors influencing health status and contact with health services, by age
- Emergency department presentations for factors influencing health status and contact with health services, Aboriginal people, by broad age group (0-14, 15-24, 25-44, 45-64 years), 2020/21
Click hereto access the maps for these atlases.
Click hereto access the graphs for these atlases.
Click hereto access the data for these atlases.
Data release: Indigenous Status Comparison: Social Health Atlas of Australia
Median age at death
- Median age at death of Indigenous/Non-Indigenous males, females, persons, 2018 to 2022
Premature mortality by sex
- Indigenous/Non-Indigenous males, females, persons: 0 to 54 years, 2018 to 2022
- Indigenous/Non-Indigenous males, females, persons: 0 to 64 years, 2018 to 2022
- Indigenous/Non-Indigenous males, females, persons: 0 to 74 years, 2018 to 2022
Premature mortality by selected cause
- Cancers, Indigenous/Non-Indigenous people: 0 to 54 years, 0 to 64 years, 0 to 74 years, 2018 to 2022
- Lung cancers, Indigenous/Non-Indigenous people: 0 to 74 years, 2018 to 2022
- Diabetes, Indigenous/Non-Indigenous people: 0 to 74 years, 2018 to 2022
- Circulatory system diseases, Indigenous/Non-Indigenous people: 0 to 54 years, 0 to 64 years, 0 to 74 years, 2018 to 2022
- Ischaemic heart disease, Indigenous/Non-Indigenous people: 0 to 74 years, 2018 to 2022
- Respiratory system diseases, Indigenous/Non-Indigenous people: 0 to 64 years, 0 to 74 years, 2018 to 2022
- Chronic obstructive pulmonary disease (COPD), Indigenous/Non-Indigenous people: 0 to 74 years, 2018 to 2022
- Cirrhosis and other diseases of the liver, Indigenous/Non-Indigenous people: 0 to 74 years, 2018 to 2022
- External causes, Indigenous/Non-Indigenous people: 0 to 54 years, 0 to 64 years, 0 to 74 years, 2018 to 2022
- Road traffic injuries, Indigenous/Non-Indigenous people: 0 to 74 years, 2018 to 2022
- Suicide and self-inflicted injuries, Indigenous/Non-Indigenous people: 0 to 74 years, 2018 to 2022
- Accidental poisoning, Indigenous/Non-Indigenous people: 0 to 74 years, 2018 to 2022
Avoidable mortality by sex
- Deaths from all avoidable causes, Indigenous/Non-Indigenous males, females, persons aged 0 to 74 years, 2018 to 2022
Avoidable mortality by selected cause
- Avoidable deaths from cancer, Indigenous/Non-Indigenous people aged 0 to 74 years, 2018 to 2022
- Avoidable deaths from diabetes, Indigenous/Non-Indigenous people aged 0 to 74 years, 2018 to 2022
- Avoidable deaths from circulatory system diseases, Indigenous/Non-Indigenous people aged 0 to 74 years, 2018 to 2022
- Avoidable deaths from ischaemic heart disease, Indigenous/Non-Indigenous people aged 0 to 74 years, 2018 to 2022
- Avoidable deaths from respiratory system diseases, Indigenous/Non-Indigenous people aged 0 to 74 years, 2018 to 2022
- Avoidable deaths from chronic obstructive pulmonary disease (COPD), Indigenous/Non-Indigenous people aged 0 to 74 years, 2018 to2022
- Avoidable deaths from selected external causes, Indigenous/Non-Indigenous people aged 0 to 74 years, 2018 to 2022
- Avoidable deaths from suicide and self-inflicted injuries, Indigenous/ Non-Indigenous people aged 0 to 74 years, 2018 to2022
- Avoidable deaths from other external causes, Indigenous/Non-Indigenous people aged 0 to 74 years, 2018 to 2022
- Avoidable deaths from transport accidents, Indigenous/Non-Indigenous people aged 0 to 74 years, 2018 to 2022
Potential years of life lost by age and sex
- Indigenous/Non-Indigenous males, females, persons aged 0 to 54 years, 2018 to 2022
- Indigenous/Non-Indigenous males, females, persons aged 0 to 64 years, 2018 to 2022
- Indigenous/Non-Indigenous males, females, persons aged 0 to 74 years, 2018 to 2022
Potential years of life lost by selected cause
- Potential years of life lost from cancer, Indigenous/Non-Indigenous people aged 0-74 years 2018 to 2022
- Potential years of life lost from lung cancer, Indigenous/Non-Indigenous people aged 0-74 years, 2018 to 2022
- Potential years of life lost from diabetes, Indigenous/Non-Indigenous people aged 0-74 years, 2018 to 2022
- Potential years of life lost from circulatory system diseases, Indigenous/Non-Indigenous people aged 0-74 years, 2018 to 2022
- Potential years of life lost from ischaemic heart disease, Indigenous/Non-Indigenous people aged 0-74 years, 2018 to 2022
- Potential years of life lost from respiratory system diseases, Indigenous/Non-Indigenous people aged 0-74 years, 2018 to 2022
- Potential years of life lost from chronic obstructive pulmonary disease (COPD), Indigenous/Non-Indigenous people aged 0-74 years, 2018 to 2022
- Potential years of life lost from external causes, Indigenous/Non-Indigenous people aged 0-74 years, 2018 to 2022
- Potential years of life lost from road traffic injuries, Indigenous/Non-Indigenous people aged 0-74 years, 2018 to 2022
- Potential years of life lost from suicide and self-inflicted injuries, Indigenous/Non-Indigenous people aged 0-74 years, 2018 to 2022
Admissions by sex (excluding same-day admissions for renal dialysis)
- Male total admissions, Indigenous/Non-Indigenous, 2017/18 to 2020/21
- Female total admissions, Indigenous/Non-Indigenous, 2017/18 to 2020/21
- Total admissions, Indigenous/Non-Indigenous, 2017/18 to 2020/21
Admissions by age (excluding same-day admissions for renal dialysis)
- Total admissions, people aged 0 to 14 years, Indigenous/Non-Indigenous people, 2017/18 to 2020/21
- Total admissions, people aged 15 to 24 years, Indigenous/Non-Indigenous people, 2017/18 to 2020/21
- Total admissions, people aged 25 to 44 years, Indigenous/Non-Indigenous people, 2017/18 to 2020/21
- Total admissions, people aged 45 to 64 years, Indigenous/Non-Indigenous people, 2017/18 to 2020/21
- Total admissions, people aged 65 years and over, Indigenous/Non-Indigenous people, 2017/18 to 2020/21
Admissions by selected principal diagnosis
- Infectious and parasitic diseases, Indigenous/Non-Indigenous people, 2017/18 to 2020/21
- Cancer, Indigenous/Non-Indigenous people, 2017/18 to 2020/21
- Endocrine, nutritional and metabolic diseases, Indigenous/Non-Indigenous people, 2017/18 to 2020/21
- Diabetes, Indigenous/Non-Indigenous people, 2017/18 to 2020/21
- Mental health-related conditions, Indigenous/ Non-Indigenous people, 2017/18 to 2020/21
- Mood affective disorders, Indigenous/Non-Indigenous people, 2017/18 to 2020/21
- Nervous system diseases, Indigenous/Non-Indigenous people, 2017/18 to 2020/21
- Eye and adnexa diseases, Indigenous/Non-Indigenous people, 2017/18 to 2020/21
- Ear and mastoid process diseases, Indigenous/Non-Indigenous people, 2017/18 to 2020/21
- Circulatory system diseases, Indigenous/Non-Indigenous people, 2017/18 to 2020/21
- Ischaemic heart disease, Indigenous/Non-Indigenous people, 2017/18 to 2020/21
- Heart failure, Indigenous/Non-Indigenous people, 2017/18 to 2020/21
- Respiratory system diseases, Indigenous/Non-Indigenous people, 2017/18 to 2020/21
- Asthma, Indigenous/Non-Indigenous people, 2017/18 to 2020/21
- Chronic obstructive pulmonary disease (COPD), Indigenous/Non-Indigenous people, 2017/18 to 2020/21
- Digestive system diseases, Indigenous/Non-Indigenous people, 2017/18 to 2020/21
- Skin and subcutaneous tissue diseases, Indigenous/Non-Indigenous people, 2017/18 to 2020/21
- Musculoskeletal system and connective tissue diseases, Indigenous/Non-Indigenous people, 2017/18 to 2020/21
- Genitourinary system diseases, Indigenous/Non-Indigenous people, 2017/18 to 2020/21
- Chronic kidney disease, Indigenous/Non-Indigenous people, 2017/18 to 2020/21
- Pregnancy, childbirth and the puerperium, females aged 15 to 44 years, Indigenous/Non-Indigenous, 2017/18 to 2020/21
- Congenital malformations, deformations and chromosomal abnormalities, Indigenous/Non-Indigenous people, 2017/18 to 2020/21
- Injury, poisoning and other external causes, Indigenous/Non-Indigenous people, 2017/18 to 2020/21
Admissions by selected principal diagnosis and age
- Infectious and parasitic diseases aged 0 to 14 years, Indigenous/Non-Indigenous people, 2017/18 to 2020/21
- Infectious and parasitic diseases aged 15 years and over, Indigenous/Non-Indigenous people, 2017/18 to 2020/21
- Respiratory system diseases aged 0 to 14 years, Indigenous/Non-Indigenous people, 2017/18 to 2020/21
- Respiratory system diseases aged 15 years and over, Indigenous/Non-Indigenous people, 2017/18 to 2020/21
- Digestive system diseases aged 0 to 14 years, Indigenous/Non-Indigenous people, 2017/18 to 2020/21
- Digestive system diseases aged 15 years and over, Indigenous/Non-Indigenous people, 2017/18 to 2020/21
- Skin and subcutaneous tissue diseases aged 0 to 14 years, Indigenous/Non-Indigenous people, 2017/18 to 2020/21
- Skin and subcutaneous tissue diseases aged 15 years and over, Indigenous/Non-Indigenous people, 2017/18 to 2020/21
- Injury, poisoning and other external causes aged 0 to 14 years, Indigenous/Non-Indigenous people, 2017/18 to 2020/21
- Injury, poisoning and other external causes aged 15 years and over, Indigenous/Non-Indigenous people, 2017/18 to 2020/21
Admissions by principal diagnosis of injury or poisoning, by external cause
- Transport crash injury, Indigenous/Non-Indigenous people, 2017/18 to 2020/21
- Falls, Indigenous/Non-Indigenous people, 2017/18 to 2020/21
- Injury due to exposure to inanimate mechanical forces, Indigenous/Non-Indigenous people, 2017/18 to 2020/21
- Injury due to exposure to animate mechanical forces, Indigenous/Non-Indigenous people, 2017/18 to 2020/21
- Intentional self-harm, Indigenous/Non-Indigenous people, 2017/18 to 2020/21
- Assault, Indigenous/Non-Indigenous people, 2017/18 to 2020/21
- Total diagnosis of injury or poisoning, by external cause, Indigenous/Non-Indigenous people, 2017/18 to 2020/21
Same-day admissions for renal dialysis
- Same-day admissions for dialysis for kidney disease, Indigenous/Non-Indigenous people, 2017/18 to 2020/21
Potentially preventable hospitalisations by age
- Potentially preventable conditions aged 0 to 14 years, Indigenous/Non-Indigenous people, 2017/18 to 2020/21
- Potentially preventable conditions aged 15 to 24 years, Indigenous/Non-Indigenous people, 2017/18 to 2020/21
- Potentially preventable conditions aged 25 to 44 years, Indigenous/Non-Indigenous people, 2017/18 to 2020/21
- Potentially preventable conditions aged 45 to 64 years, Indigenous/Non-Indigenous people, 2017/18 to 2020/21
- Potentially preventable conditions aged 65 years and over, Indigenous/Non-Indigenous people, 2017/18 to 2020/21
- Potentially preventable conditions, total, Indigenous/Non-Indigenous people, 2017/18 to 2020/21
Potentially preventable hospitalisations - Vaccine-preventable conditions
- Vaccine-preventable conditions - pneumonia and influenza, Indigenous/Non-Indigenous people, 2017/18 to 2020/21
- Total Vaccine-preventable conditions, Indigenous/Non-Indigenous people, 2017/18 to 2020/21
Potentially preventable hospitalisations - Acute conditions
- Acute cellulitis, Indigenous/Non-Indigenous people, 2017/18 to 2020/21
- Acute convulsions and epilepsy, Indigenous/Non-Indigenous people, 2017/18 to 2020/21
- Acute dental conditions, Indigenous/Non-Indigenous people, 2017/18 to 2020/21
- Acute ear, nose and throat infections, Indigenous/Non-Indigenous people, 2017/18 to 2020/21
- Acute urinary tract infections, including pyelonephritis, Indigenous/Non-Indigenous people, 2017/18 to 2020/21
- Total acute conditions, Indigenous/Non-Indigenous people, 2017/18 to 2020/21
Potentially preventable hospitalisations - Chronic conditions
- Chronic angina, Indigenous/Non-Indigenous people, 2017/18 to 2020/21
- Chronic asthma, Indigenous/Non-Indigenous people, 2017/18 to 2020/21
- Chronic congestive cardiac failure, Indigenous/Non-Indigenous people, 2017/18 to 2020/21
- Chronic obstructive pulmonary disease (COPD), Indigenous/Non-Indigenous people, 2017/18 to 2020/21
- Chronic diabetes complications, Indigenous/Non-Indigenous people, 2017/18 to 2020/21
- Chronic iron deficiency anaemia, Indigenous/Non-Indigenous people, 2017/18 to 2020/21
- Total chronic conditions, Indigenous/Non-Indigenous people, 2017/18 to 2019/21
Emergency department presentations, by sex
- Male emergency department presentations, Indigenous/Non-Indigenous males, 2020/21
- Female emergency department presentations, Indigenous/Non-Indigenous females, 2020/21
- Total emergency department presentations, Indigenous/Non-Indigenous persons, 2020/21
Emergency department presentations, by age
- Total emergency department presentations, Indigenous/Non-Indigenous people aged 0-14, 15-24, 25-44, 45-64, 65+ years, 2020/21
Emergency department presentations, by triage category
- Resuscitation and emergency presentations, Indigenous/Non-Indigenous people, 2020/21
- Urgent presentations, Indigenous/Non-Indigenous people, 2020/21
- Semi-urgent presentations, Indigenous/Non-Indigenous people, 2020/21
- Non-urgent presentations, Indigenous/Non-Indigenous people, 2020/21
Emergency department presentations - resuscitation, emergency and urgent, by principal diagnosis
- Resuscitation, emergency and urgent presentations for certain infectious and parasitic diseases, Indigenous/Non-Indigenous people, 2020/21
- Resuscitation, emergency and urgent presentations for mental and behavioural disorders, Indigenous/Non-Indigenous people, 2020/21
- Resuscitation, emergency and urgent presentations for diseases of the circulatory system, Indigenous/Non-Indigenous people, 2020/21
- Resuscitation, emergency and urgent presentations for diseases of the respiratory system, Indigenous/Non-Indigenous people, 2020/21
- Resuscitation, emergency and urgent presentations for diseases of the digestive system, Indigenous/Non-Indigenous people, 2020/21
- Resuscitation, emergency and urgent presentations for diseases of the musculoskeletal system and connective tissue, Indigenous/Non-Indigenous people, 2020/21
- Resuscitation, emergency and urgent presentations for diseases of the genitourinary system, Indigenous/Non-Indigenous people, 2020/21
- Resuscitation, emergency and urgent presentations for injury, poisoning and certain other consequences of external causes, Indigenous/Non-Indigenous people, 2020/21
- Resuscitation, emergency and urgent presentations or factors influencing health status and contact with health services, Indigenous/Non-Indigenous people, 2020/21
Emergency department presentations, by principal diagnosis, by sex
- Total emergency department presentations for certain infectious and parasitic diseases, Indigenous/Non-Indigenous males, females, persons, 2020/21
- Total emergency department presentations for mental and behavioural disorders, Indigenous/Non-Indigenous males, females, persons, 2020/21
- Total emergency department presentations for diseases of the circulatory system, Indigenous/Non-Indigenous males, females, persons, 2020/21
- Total emergency department presentations for diseases of the respiratory system, Indigenous/Non-Indigenous males, females, persons, 2020/21
- Total emergency department presentations for diseases of the digestive system, Indigenous/Non-Indigenous males, females, persons, 2020/21
- Total emergency department presentations for diseases of the musculoskeletal system and connective tissue, Indigenous/Non-Indigenous males, females, persons2020/21
- Total emergency department presentations for diseases of the genitourinary system, Indigenous/Non-Indigenous males, females, persons,2020/21
- Total emergency department presentations for injury, poisoning and certain other consequences of external causes, Indigenous/Non-Indigenous males, females, persons,2020/21
- Total emergency department presentations for factors influencing health status and contact with health services, Indigenous/Non-Indigenous males, females, persons,2020/21
Emergency department presentations for mental and behavioural disorders, by age
- Emergency department presentations for mental and behavioural disorders, Indigenous/Non-Indigenous people aged 15-24, 25-44, 45-64 years, 2020/21
Emergency department presentations for disease of the respiratory system, by age
- Emergency department presentations for diseases of the respiratory system, Indigenous/Non-Indigenous people aged 0-14, 15-24, 25-44, 45-64 years, 2020/21
Emergency department presentations for diseases of the digestive system, by age
- Emergency department presentations for diseases of the digestive system, Indigenous/Non-Indigenous people aged 0-14, 15-24, 25-44, 45-64 years, 2020/21
Emergency department presentations for diseases of the musculoskeletal system and connective tissue, by age
- Emergency department presentations for diseases of the musculoskeletal system and connective tissue, Indigenous/Non-Indigenous people aged 0-14, 15-24, 25-44, 45-64 years, 2020/21
Emergency department presentations for diseases of the genitourinary system, by age
- Emergency department presentations for diseases of the genitourinary system, Indigenous/Non-Indigenous people aged 15-24, 25-44, 45-64 years, 2020/21
Emergency department presentations for injury, poisoning and certain other consequences of external causes, by age and sex
- Emergency department presentations for injury, poisoning and other external causes, Indigenous/Non-Indigenous males, females, persons, by broad age group (0-14, 15-24, 25-44, 45-64 years), 2020/21
Emergency department presentations for factors influencing health status and contact with health services, by age
- Emergency department presentations for factors influencing health status and contact with health services, Indigenous/Non-Indigenous males, females, persons, by broad age group (0-14, 15-24, 25-44, 45-64 years), 2020/21
Click hereto access the maps for these atlases.
Click hereto access the graphs for these atlases.
Click hereto access the data for these atlases.
Data release: 14 June 2024
Data release: By Population Health Area, Local Government Area, Primary Health Network, quintile of socioeconomic disadvantage of area (including within Primary Health Networks) and Remoteness Area
Social Health Atlases of Australia
Vocational education and training
- Participation in vocational education and training - Aboriginal population, 2022
- Participation in vocational education and training - Total population, 2022
- Subject completion rates in vocational education and training - Government-funded hours, 2022
- Subject completion rates in vocational education and training - Private-funded hours, 2022
- Subject completion rates in vocational education and training - Total student hours, 2022
- Subject completion rates in vocational education and training - Aboriginal student hours, 2022
Bowel screening
- Bowel screening participation: males, females, persons, 2020 and 2021
- Bowel screening outcomes: positive screening result, males, females, persons, 2020 and 2021
Click hereto access the maps for these atlases.
Click hereto access the graphs for these atlases.
Click hereto access the data for these atlases.
Data release: By Indigenous Area, Primary Health Networks, quintile of Indigenous Relative Socioeconomic Outcomes and Remoteness Areas
Aboriginal & Torres Strait Islander Social Health Atlases of Australia
Vocational education and training
- Participation of Aboriginal people in vocational education and training, 2022
- Subject completion rates in vocational education and training, Aboriginal students, 2022
Admissions by sex (excluding same-day admissions for renal dialysis)
Four year time period
- Male, female, and total admissions, 2017/18 to 2020/21
Admissions by age (excluding same-day admissions for renal dialysis)
Four year time period
- Total admissions, people broad age groups, 2017/18 to 2020/21
Admissions by age (excluding same-day admissions for renal dialysis)
Four year time period
- Infectious and parasitic diseases, 2017/18 to 2020/21
- Cancer, 2017/18 to 2020/21
- Endocrine, nutritional and metabolic diseases, 2017/18 to 2020/21
- Diabetes, 2017/18 to 2020/21
- Mental health-related conditions, 2017/18 to 2020/21
- Mood affective disorders, 2017/18 to 2020/21
- Nervous system diseases, 2017/18 to 2020/21
- Eye and adnexa diseases, 2017/18 to 2020/21
- Ear and mastoid process diseases, 2017/18 to 2020/21
- Circulatory system diseases, 2017/18 to 2020/21
- Ischaemic heart disease, 2017/18 to 2020/21
- Heart failure, 2017/18 to 2020/21
- Respiratory system diseases, 2017/18 to 2020/21
- Asthma, 2017/18 to 2020/21
- Chronic obstructive pulmonary disease (COPD), 2017/18 to 2020/21
- Digestive system diseases, 2017/18 to 2020/21
- Skin and subcutaneous tissue diseases, 2017/18 to 2020/21
- Musculoskeletal system and connective tissue diseases, 2017/18 to 2020/21
- Genitourinary system diseases, 2017/18 to 2020/21
- Chronic kidney disease, 2017/18 to 2020/21
- Pregnancy, childbirth and the puerperium, females aged 15 to 44 years, 2017/18 to 2020/21
- Congenital malformations, deformations and chromosomal abnormalities, 2017/18 to 2020/21
- Injury, poisoning and other external causes, 2017/18 to 2020/21
Admissions by selected principal diagnosis and age
Four year time period
- Infectious and parasitic diseases aged 0 to 14 years, 2017/18 to 2020/21
- Infectious and parasitic diseases aged 15 years and over, 2017/18 to 2020/21
- Respiratory system diseases aged 0 to 14 years, 2017/18 to 2020/21
- Respiratory system diseases aged 15 years and over, 2017/18 to 2020/21
- Digestive system diseases aged 0 to 14 years, 2017/18 to 2020/21
- Digestive system diseases aged 15 years and over, 2017/18 to 2020/21
- Skin and subcutaneous tissue diseases aged 0 to 14 years, 2017/18 to 2020/21
- Skin and subcutaneous tissue diseases aged 15 years and over, 2017/18 to 2020/21
- Injury, poisoning and other external causes aged 0 to 14 years, 2017/18 to 2020/21
- Injury, poisoning and other external causes aged 15 years and over, 2017/18 to 2020/21
Admissions by principal diagnosis of injury or poisoning, by external cause
Four year time period
- Transport crash injury, 2017/18 to 2020/21
- Falls, 2017/18 to 2020/21
- Injury due to exposure to inanimate mechanical forces, 2017/18 to 2020/21
- Injury due to exposure to animate mechanical forces, 2017/18 to 2020/21
- Intentional self-harm, 2017/18 to 2020/21
- Assault, 2017/18 to 2020/21
- Total diagnosis of injury or poisoning, by external cause, 2017/18 to 2020/21
Same-day admissions for renal dialysis
Four year time period
- Same-day admissions for dialysis for kidney disease, 2017/18 to 2020/21
Potentially preventable hospitalisations by age
Four year time period
- Potentially preventable conditions aged 0 to 14 years, 2017/18 to 2020/21
- Potentially preventable conditions aged 15 to 24 years, 2017/18 to 2020/21
- Potentially preventable conditions aged 25 to 44 years, 2017/18 to 2020/21
- Potentially preventable conditions aged 45 to 64 years, 2017/18 to 2020/21
- Potentially preventable conditions aged 65 years and over, 2017/18 to 2020/21
- Potentially preventable conditions, total, 2017/18 to 2020/21
Potentially preventable hospitalisations - Vaccine-preventable conditions
Four year time period
- Vaccine-preventable conditions - pneumonia and influenza, 2017/18 to 2020/21
- Total Vaccine-preventable conditions, 2017/18 to 2020/21
Potentially preventable hospitalisations - Acute conditions
Four year time period
- Acute cellulitis, 2017/18 to 2020/21
- Acute convulsions and epilepsy, 2017/18 to 2020/21
- Acute dental conditions, 2017/18 to 2020/21
- Acute ear, nose and throat infections, 2017/18 to 2020/21
- Acute urinary tract infections, including pyelonephritis, 2017/18 to 2020/21
- Total acute conditions, 2017/18 to 2020/21
Potentially preventable hospitalisations - Chronic conditions
Four year time period
- Chronic angina, 2017/18 to 2020/21
- Chronic asthma, 2017/18 to 2020/21
- Chronic congestive cardiac failure, 2017/18 to 2020/21
- Chronic obstructive pulmonary disease (COPD), 2017/18 to 2020/21
- Chronic diabetes complications, 2017/18 to 2020/21
- Chronic iron deficiency anaemia, 2017/18 to 2020/21
- Total chronic conditions, 2017/18 to 2020/21
Click hereto access the maps for these atlases.
Click hereto access the graphs for these atlases.
Click hereto access the data for these atlases.
Data release: By quintile of Indigenous Relative Socioeconomic Outcomes and Remoteness Areas time series
Aboriginal & Torres Strait Islander Social Health Atlases of Australia
Vocational education and training
- Participation of Aboriginal people in vocational education and training, 2022
- Subject completion rates in vocational education and training, Aboriginal students, 2022
Mothers and babies
- Low birthweight babies, 2019 to 2021
- Women smoking during pregnancy, 2019 to 2021
Admissions by sex (excluding same-day admissions for renal dialysis)
Four year time period
- Male, female, and total admissions, 2017/18 to 2020/21
Admissions by age (excluding same-day admissions for renal dialysis)
Four year time period
- Total admissions, people broad age groups, 2017/18 to 2020/21
Admissions by age (excluding same-day admissions for renal dialysis)
Four year time period
- Infectious and parasitic diseases, 2017/18 to 2020/21
- Cancer, 2017/18 to 2020/21
- Endocrine, nutritional and metabolic diseases, 2017/18 to 2020/21
- Mental health-related conditions, 2017/18 to 2020/21
- Nervous system diseases, 2017/18 to 2020/21
- Eye and adnexa diseases, 2017/18 to 2020/21
- Ear and mastoid process diseases, 2017/18 to 2020/21
- Circulatory system diseases, 2017/18 to 2020/21
- Respiratory system diseases, 2017/18 to 2020/21
- Digestive system diseases, 2017/18 to 2020/21
- Skin and subcutaneous tissue diseases, 2017/18 to 2020/21
- Musculoskeletal system and connective tissue diseases, 2017/18 to 2020/21
- Genitourinary system diseases, 2017/18 to 2020/21
- Pregnancy, childbirth and the puerperium, females aged 15 to 44 years, 2017/18 to 2020/21
- Congenital malformations, deformations and chromosomal abnormalities, 2017/18 to 2020/21
- Injury, poisoning and other external causes, 2017/18 to 2020/21
Admissions by selected principal diagnosis and age
Four year time period
- Infectious and parasitic diseases aged 0 to 14 years, 2017/18 to 2020/21
- Infectious and parasitic diseases aged 15 years and over, 2017/18 to 2020/21
- Respiratory system diseases aged 0 to 14 years, 2017/18 to 2020/21
- Respiratory system diseases aged 15 years and over, 2017/18 to 2020/21
- Digestive system diseases aged 0 to 14 years, 2017/18 to 2020/21
- Digestive system diseases aged 15 years and over, 2017/18 to 2020/21
- Skin and subcutaneous tissue diseases aged 0 to 14 years, 2017/18 to 2020/21
- Skin and subcutaneous tissue diseases aged 15 years and over, 2017/18 to 2020/21
- Injury, poisoning and other external causes aged 0 to 14 years, 2017/18 to 2020/21
- Injury, poisoning and other external causes aged 15 years and over, 2017/18 to 2020/21
Same-day admissions for renal dialysis
Four year time period
- Same-day admissions for dialysis for kidney disease, 2017/18 to 2020/21
Potentially preventable hospitalisations by age
Four year time period
- Potentially preventable conditions aged 0 to 14 years, 2017/18 to 2020/21
- Potentially preventable conditions aged 15 to 24 years, 2017/18 to 2020/21
- Potentially preventable conditions aged 25 to 44 years, 2017/18 to 2020/21
- Potentially preventable conditions aged 45 to 64 years, 2017/18 to 2020/21
- Potentially preventable conditions aged 65 years and over, 2017/18 to 2020/21
- Potentially preventable conditions, total, 2017/18 to 2020/21
Potentially preventable hospitalisations - Vaccine-preventable conditions
Four year time period
- Total Vaccine-preventable conditions, 2017/18 to 2020/21
Potentially preventable hospitalisations - Acute conditions
Four year time period
- Acute cellulitis, 2017/18 to 2020/21
- Acute convulsions and epilepsy, 2017/18 to 2020/21
- Acute dental conditions, 2017/18 to 2020/21
- Acute ear, nose and throat infections, 2017/18 to 2020/21
- Acute urinary tract infections, including pyelonephritis, 2017/18 to 2020/21
- Total acute conditions, 2017/18 to 2020/21
Potentially preventable hospitalisations - Chronic conditions
Four year time period
- Chronic obstructive pulmonary disease (COPD), 2017/18 to 2020/21
- Chronic diabetes complications, 2017/18 to 2020/21
- Total chronic conditions, 2017/18 to 2020/21
Click hereto access the graphs for these atlases.
Click hereto access the data for these atlases.
Data release: 30 April 2024
Data release: By Population Health Area, Local Government Area, Primary Health Network, quintile of socioeconomic disadvantage of area (including within Primary Health Networks) and Remoteness Area
Social Health Atlases of Australia
Age distribution
- Aboriginal males, females, persons: broad age groups, 2021
Excluding quintile of socioeconomic disadvantage of area (including within Primary Health Networks)
Aboriginal population as a proportion of the total population
- Aboriginal population, and by broad age groups, 2021
Mothers and Babies
- Low birthweight babies, 2019 to 2021
- Mothers who reported smoking during a pregnancy, 2019 to 2021
- Women who did not attend antenatal care within the first 10 weeks, 2019 to 2021
Commonwealth Home Support Programme
- Clients living alone, 2022/23
- Clients with carer, 2022/23
- Indigenous clients (per total clients), 2022/23
- Indigenous clients (per Indigenous population), 2022/23
- Non-English-speaking clients, 2022/23
- Total clients, 2022/23
- Allied health therapy clients, 2022/23
- Domestic assistance clients, 2022/23
- Flexible respite clients, 2022/23
- Goods and equipment clients, 2022/23
- Home maintenance clients, 2022/23
- Home modification clients, 2022/23
- Meals clients, 2022/23
- Nursing clients, 2022/23
- Personal care clients, 2022/23
- Social support (group) clients, 2022/23
- Social support (individual) clients, 2022/23
- Specialised support services clients, 2022/23
- Transport clients, 2022/23
Click hereto access the maps for these atlases.
Click hereto access the graphs for these atlases.
Click hereto access the data for these atlases.
Data release: By quintile of socioeconomic disadvantage of area and Remoteness Area time series
Social Health Atlases of Australia
Aboriginal population as a proportion of the total population
- Aboriginal population: by broad age groups, 2021
Mothers and Babies
- Low birthweight babies, 2019 to 2021
- Mothers who reported smoking during a pregnancy, 2019 to 2021
Click hereto access the graphs for these atlases.
Click hereto access the data for these atlases.
Data release: By Indigenous Area, Primary Health Networks, quintile of Indigenous Relative Socioeconomic Outcomes and Remoteness Areas
Aboriginal & Torres Strait Islander Social Health Atlases of Australia
Age distribution
- Aboriginal males, females, persons: 5 year age groups 2021
Excluding quintile of Indigenous Relative Socioeconomic Outcomes
Aboriginal population as a proportion of the total population
- Aboriginal population, and by by 5 year age groups, 2021
Preschool
- Preschool enrolments: Aboriginal children aged 4 or 5 years, 2022
- Preschool attendance: Aboriginal children aged 4 or 5 years, 2022
Higher education
- Aboriginal school leavers enrolled in higher education, 2023
Mothers and Babies
- Low birthweight babies, born to Aboriginal mothers, 2019 to 2021
- Aboriginal women who reported smoking during a pregnancy, 2019 to 2021
- Aboriginal women who did not attend antenatal care within the first 10 weeks, 2019 to 2021
Click hereto access the maps for these atlases.
Click hereto access the graphs for these atlases.
Click hereto access the data for these atlases.
Data release: Indigenous Status Comparison: Social Health Atlas of Australia
Age distribution
- Indigenous/non-Indigenous males, females, persons: 5 year age groups, 2021
Excluding quintile of Indigenous Relative Socioeconomic Outcomes
Indigenous/non-Indigenous population as a proportion of the total population
- Indigenous/non-Indigenous population, and by 5 year age groups, 2021
Preschool
- Preschool enrolments: Indigenous/non-Indigenous children aged 4 or 5 years, 2022
- Preschool attendance: Indigenous/non-Indigenous children aged 4 or 5 years, 2022
Higher education
- Indigenous/non-Indigenous school leavers enrolled in higher education, 2023
Mothers and Babies
- Low birthweight babies, born to Indigenous/non-Indigenous mothers, 2019 to 2021
- Indigenous/non-Indigenous women who reported smoking during a pregnancy, 2019 to 2021
- Indigenous/non-Indigenous women who did not attend antenatal care within the first 10 weeks, 2019 to 2021
Click hereto access the maps for these atlases.
Click hereto access the graphs for these atlases.
Click hereto access the data for these atlases.
Data release: 27 March 2024
Data release: By Population Health Area, Local Government Area, Primary Health Network, quintile of socioeconomic disadvantage of area (including within Primary Health Networks) and Remoteness Area
Social Health Atlases of Australia
Humanitarian migrants
- Permanent migrants entering Australia under the Offshore Humanitarian Program who arrived between 2000 and 9 August 2011, 2000 and 9 August 2016, and 2000 and 10 August 2021, 2021
Family migrants
- Permanent migrants entering Australia on a Child, Partner, Parent or Other Family stream visa who arrived between 2000 and 9 August 2011, 2000 and 9 August 2016, and 2000 and 10 August 2021, 2021
Skilled migrants
- Permanent migrants entering Australia on a Skill stream visa who arrived between 2000 and 9 August 2011, 2000 and 9 August 2016, and 2000 and 10 August 2021, 2021
Fertility
- Total fertility rate, 2022
Education
- School leavers enrolled in higher education, 2023
Housing, rent assistance and vehicle access
- Households in dwellings receiving rent assistance from the Australian Government, June 2023
- Aboriginal households in dwellings receiving rent assistance from the Australian Government, June 2023
Income support recipients
- Age pensioners, June 2023
- Disability support pensioners, June 2023
- Female sole parent pensioners, June 2023
- People receiving an unemployment benefit, June 2023
- People aged 22 to 64 receiving a JobSeeker Payment, June 2023
- Young people aged 16 to 21 receiving Youth Allowance (other), June 2023
- People receiving a JobSeeker Payment or Youth Allowance (other) for less than 180 days, June 2023
- People receiving a JobSeeker Payment or Youth Allowance (other) for longer than 180 days, June 2023
- Low income, welfare-dependent families (with children), June 2023
- Children in low income, welfare-dependent families, June 2023
- Pensioner Concession Card holders, June 2023
- Health Care Card holders, June 2023
- Seniors Health Card holders, June 2023
Long-term health conditions (ABS Census), number of conditions
- People who reported they had no long-term health condition, All ages, 15+ years, 0-14 years, 2021
Disability (NDIS)
- National Disability Insurance Scheme (NDIS) active participants, June 2023
Health workforce (LGA and PHN only)
- General Medical Practitioners, 2022
- Hospital Practitioners non-specialist, 2022
- Specialist Practitioners, 2022
- Specialist Practitioners in training, 2022
- Total Medical Practitioners, 2022
- Registered Nurses only, 2022
- Registered Nurses who are also Midwives, 2022
- Total Registered Nurses, 2022
- Enrolled Nurses, 2022
- Midwives (may also be a Registered Nurse or Enrolled Nurse), 2022
- Total Nurses (Registered Nurses, Enrolled Nurses or Midwives, each person only counted once), 2022
- Dentists, 2022
- Total Dental Practitioners (includes Dentists, Oral health therapists, Dental hygienists, Dental therapists and Dental prosthetists), 2022
Click hereto access the maps for these atlases.
Click hereto access the graphs for these atlases.
Click hereto access the data for these atlases.
Data release: By quintile of socioeconomic disadvantage of area and Remoteness Area time series
Social Health Atlases of Australia
Fertility
- Total fertility rate, 2022
Education
- School leavers enrolled in higher education, 2023
Housing, rent assistance and vehicle access
- Households in dwellings receiving rent assistance from the Australian Government, June 2023
- Aboriginal households in dwellings receiving rent assistance from the Australian Government, June 2023
Income support recipients
- Age pensioners, June 2023
- Disability support pensioners, June 2023
- Female sole parent pensioners, June 2023
- People receiving an unemployment benefit, June 2023
- People aged 22 to 64 receiving a JobSeeker Payment, June 2023
- Young people aged 16 to 21 receiving Youth Allowance (other), June 2023
- People receiving a JobSeeker Payment or Youth Allowance (other) for less than 180 days, June 2023
- People receiving a JobSeeker Payment or Youth Allowance (other) for longer than 180 days, June 2023
- Low income, welfare-dependent families (with children), June 2023
- Children in low income, welfare-dependent families, June 2023
- Pensioner Concession Card holders, June 2023
- Health Care Card holders, June 2023
- Seniors Health Card holders, June 2023
Labour force
- Unemployment, June 2023
- Labour force participation, June 2023
Child and youth health
- Infant mortality, 2017 to 2021
- Deaths from all causes, aged 15 to 24 years, 2017 to 2021
Median age at death by sex
- Median age at death of males, females, persons, 2017 to 2021
Premature mortality by sex
- Deaths of males, females, persons aged 0 to 74 years, 2017 to 2021
Premature mortality by selected cause
- Deaths from cancer, people aged 0 to 74 years, 2017 to 2021
- Deaths from colorectal cancer, people aged 0 to 74 years, 2017 to 2021
- Deaths from lung cancer, people aged 0 to 74 years, 2017 to 2021
- Deaths from breast cancer, females aged 0 to 74 years, 2017 to 2021
- Deaths from diabetes, people aged 0 to 74 years, 2017 to 2021
- Deaths from circulatory system diseases, people aged 0 to 74 years, 2017 to 2021
- Deaths from ischaemic heart disease, people aged 0 to 74 years, 2017 to 2021
- Deaths from cerebrovascular diseases, people aged 0 to 74 years, 2017 to 2021
- Deaths from respiratory system diseases, people aged 0 to 74 years, 2017 to 2021
- Deaths from chronic obstructive pulmonary disease, people aged 0 to 74 years, 2017 to 2021
- Deaths from external causes, people aged 0 to 74 years, 2017 to 2021
- Deaths from road traffic injuries, people aged 0 to 74 years, 2017 to 2021
- Deaths from suicide and self-inflicted injuries, people aged 0 to 74 years, 2017 to 2021
Avoidable mortality by sex
- Deaths of males, females, persons aged 0 to 74 years, 2017 to 2021
Avoidable mortality by selected cause
- Avoidable deaths from cancer, people aged 0 to 74 years, 2017 to 2021
- Avoidable deaths from colorectal cancer, people aged 0 to 74 years, 2017 to 2021
- Avoidable deaths from breast cancer, females aged 0 to 74 years, 2017 to 2021
- Avoidable deaths from diabetes, people aged 0 to 74 years, 2017 to 2021
- Avoidable deaths from circulatory system diseases, people aged 0 to 74 years, 2017 to 2021
- Avoidable deaths from ischaemic heart disease, people aged 0 to 74 years, 2017 to 2021
- Avoidable deaths from cerebrovascular diseases, people aged 0 to 74 years, 2017 to 2021
- Avoidable deaths from respiratory system diseases, people aged 0 to 74 years, 2017 to 2021
- Avoidable deaths from chronic obstructive pulmonary disease, people aged 0 to 74 years, 2017 to 2021
- Avoidable deaths from selected external causes of mortality (Falls; Fires, burns; Suicide and self-inflicted injuries; etc.), people aged 0 to 74 years, 2017 to 2021
- Avoidable deaths from suicide and self-inflicted injuries, people aged 0 to 74 years, 2017 to 2021
- Avoidable deaths from other external causes of mortality (Transport accidents; Accidental drowning and submersion; etc.), people aged 0 to 74 years, 2017 to 2021
- Avoidable deaths from transport accidents, people aged 0 to 74 years, 2017 to 2021
Admissions by hospital type and sex (excluding same-day admissions for renal dialysis)
- Male total admissions - Public, All hospitals, 2020/21
- Female total admissions - Public, All hospitals, 2020/21
- Total admissions - Public, Private, All hospitals, 2020/21
Admissions by principal diagnosis, Public hospitals - Males, Females, Persons
- Infectious and parasitic diseases, 2020/21
- All cancers, 2020/21
- Endocrine, nutritional and metabolic diseases, 2020/21
- Diabetes, 2020/21
- Mental health-related conditions, 2020/21
- Mood affective disorders, 2020/21
- Nervous system diseases, 2020/21
- Eye and adnexa diseases, 2020/21
- Ear and mastoid process diseases, 2020/21
- Circulatory system diseases, 2020/21
- Ischaemic heart disease, 2020/21
- Heart failure, 2020/21
- Stroke, 2020/21
- Respiratory system diseases, 2020/21
- Asthma, 2020/21
- Chronic obstructive pulmonary disease (COPD), 2020/21
- Digestive system diseases, 2020/21
- Skin and subcutaneous tissue diseases, 2020/21
- Musculoskeletal system and connective tissue diseases, 2020/21
- Genitourinary system diseases, 2020/21
- Chronic kidney disease, 2020/21
- Pregnancy and childbirth 15 to 44 years (Females only), 2020/21
- Certain conditions originating in the perinatal period (Persons only), 2020/21
- Congenital malformations, deformations and chromosomal abnormalities, 2020/21
- Injury, poisoning and other external causes, 2020/21
Admissions by procedure
- Tonsillectomy - Public, Private, All hospitals, 2020/21
- Myringotomy, 0 to 9 years - Public, Private, All hospitals, 2020/21
- Hysterectomy, females aged 30 to 59 years - Public, Private, All hospitals, 2020/21
- Caesarean section, females aged 15 to 44 years - Public, Private, All hospitals, 2020/21
- Hip fracture - Public, Private, All hospitals, 2020/21
- Fibre optic colonoscopy - Public, Private, All hospitals, 2020/21
- Fibre optic colonoscopy excision - Public, Private, All hospitals, 2020/21
Same-day admissions for renal dialysis, Public hospitals
- Same-day dialysis for kidney disease, 2020/21
Potentially preventable hospitalisations, Public hospitals - by broad age groups
- Potentially preventable conditions, by broad age groups, 2020/21
Potentially preventable hospitalisations, Public hospitals - Vaccine-preventable conditions
- Vaccine-preventable conditions - pneumonia and influenza, 2020/21
- Total vaccine-preventable conditions, 2020/21
Potentially preventable hospitalisations, Public hospitals - Acute conditions
- Acute cellulitis, 2020/21
- Acute convulsions and epilepsy, 2020/21
- Acute dental conditions, 2020/21
- Acute ear, nose and throat infections, 2020/21
- Acute urinary tract infections, including pyelonephritis, 2020/21
- Total acute conditions, 2020/21
Potentially preventable hospitalisations, Public hospitals - Chronic conditions
- Chronic angina, 2020/21
- Chronic asthma, 2020/21
- Chronic congestive cardiac failure, 2020/21
- Chronic obstructive pulmonary disease (COPD), 2020/21
- Chronic diabetes complications, 2020/21
- Chronic iron deficiency anaemia, 2020/21
- Total chronic conditions, 2020/21
Emergency department presentations
- Emergency department presentations, 2020/21
Click hereto access the graphs for these atlases.
Click hereto access the data for these atlases.
Data release: By Indigenous Area, Primary Health Networks, quintile of Indigenous Relative Socioeconomic Outcomes and Remoteness Areas
As of this release, the graphs for all Census-derived indicators have been based on the 2021 Indigenous Relative Socioeconomic Outcomes.
Aboriginal & Torres Strait Islander Social Health Atlases of Australia
Housing
- Aboriginal households in dwellings receiving rent assistance from the Australian Government, June 2023
Labour force
- Aboriginal male labour force participation, 2021
Long-term health conditions (ABS Census), number of conditions
- People who reported they had no long-term health condition, All ages, 15+ years, 0-14 years, 2021
Click hereto access the maps for these atlases.
Click hereto access the graphs for these atlases.
Click hereto access the data for these atlases.
Data release: Indigenous Status Comparison: Social Health Atlas of Australia
As of this release, the graphs for all Census-derived indicators have been based on the 2021 Indigenous Relative Socioeconomic Outcomes.
The Indigenous Status Comparison: Social Health Atlas of Australia, presents selected topics and compares indicators between Indigenous and Non-Indigenous populations in Australia. This is available by Indigenous Areas, including total for the Greater Capital City Statistical Areas/Rest of States/NT; and States/Territories.
The topics and indicators in this latest release are listed below.
Labour force
- Indigenous/Non-Indigenous male labour force participation, 2021
Long-term health conditions (ABS Census), number of conditions
- Indigenous/Non-Indigenous people who reported they had no long-term health condition, All ages, 15+ years, 0-14 years, 2021
Click hereto access the maps for these atlases.
Click hereto access the graphs for these atlases.
Click hereto access the data for these atlases.
Errata: 18 January 2024
Incorrect data were published in June 2023 for the below indicator/ geographies:
- The Usual resident population (Census 2021) only for the Index of Relative Socio-economic Disadvantage - Statistical Areas 3 and 4 located within the Population Health Area geography.
2023
Data release: 23 December 2023
Website training video
Atlases
Data release: By Population Health Area, Local Government Area, Primary Health Network, quintile of socioeconomic disadvantage of area (including within Primary Health Networks) and Remoteness Area
Social Health Atlases of Australia
Age distribution - estimated resident population (ERP)
- Age distribution - 5 year age groups, and broad age groups: Males, Females, Persons (ERP), 2022
Aboriginal age distribution - estimated resident population (erp)
- Age distribution - 5 year age groups, and broad age groups: Aboriginal Males, Females, Persons (erp), 2021
Aboriginal population as a proportion of the total population, erp
- Aboriginal population, and Aboriginal population: 5 year age groups, 2021
Education
- Preschool enrolments, 2022
- Preschool attendance, 2022
Labour force
- Unemployment, June 2023
- Labour force participation, June 2023
- Male labour force participation, 2021
Child and youth health
- Infant mortality, 2017 to 2021
- Deaths from all causes, aged 15 to 24 years, 2017 to 2021
Median age at death by sex
- Median age at death of males, females, persons, 2017 to 2021
Premature mortality by sex
- Deaths of males, females, persons aged 0 to 74 years, 2017 to 2021
Premature mortality by selected cause
- Deaths from cancer, people aged 0 to 74 years, 2017 to 2021
- Deaths from colorectal cancer, people aged 0 to 74 years, 2017 to 2021
- Deaths from lung cancer, people aged 0 to 74 years, 2017 to 2021
- Deaths from breast cancer, females aged 0 to 74 years, 2017 to 2021
- Deaths from diabetes, people aged 0 to 74 years, 2017 to 2021
- Deaths from circulatory system diseases, people aged 0 to 74 years, 2017 to 2021
- Deaths from ischaemic heart disease, people aged 0 to 74 years, 2017 to 2021
- Deaths from cerebrovascular diseases, people aged 0 to 74 years, 2017 to 2021
- Deaths from respiratory system diseases, people aged 0 to 74 years, 2017 to 2021
- Deaths from chronic obstructive pulmonary disease, people aged 0 to 74 years, 2017 to 2021
- Deaths from external causes, people aged 0 to 74 years, 2017 to 2021
- Deaths from road traffic injuries, people aged 0 to 74 years, 2017 to 2021
- Deaths from suicide and self-inflicted injuries, people aged 0 to 74 years, 2017 to 2021
- Deaths from suicide and self-inflicted injuries, people aged 0 to 44 years, 2017 to 2021
- Deaths from suicide and self-inflicted injuries, people aged 45 to 74 years, 2017 to 2021
Avoidable mortality by sex
- Deaths of males, females, persons aged 0 to 74 years, 2017 to 2021
Avoidable mortality by selected cause
- Avoidable deaths from cancer, people aged 0 to 74 years, 2017 to 2021
- Avoidable deaths from colorectal cancer, people aged 0 to 74 years, 2017 to 2021
- Avoidable deaths from breast cancer, females aged 0 to 74 years, 2017 to 2021
- Avoidable deaths from diabetes, people aged 0 to 74 years, 2017 to 2021
- Avoidable deaths from circulatory system diseases, people aged 0 to 74 years, 2017 to 2021
- Avoidable deaths from ischaemic heart disease, people aged 0 to 74 years, 2017 to 2021
- Avoidable deaths from cerebrovascular diseases, people aged 0 to 74 years, 2017 to 2021
- Avoidable deaths from respiratory system diseases, people aged 0 to 74 years, 2017 to 2021
- Avoidable deaths from chronic obstructive pulmonary disease, people aged 0 to 74 years, 2017 to 2021
- Avoidable deaths from selected external causes of mortality (Falls; Fires, burns; Suicide and self-inflicted injuries; etc.), people aged 0 to 74 years, 2017 to 2021
- Avoidable deaths from suicide and self-inflicted injuries, people aged 0 to 74 years, 2017 to 2021
- Avoidable deaths from suicide and self-inflicted injuries, people aged 0 to 44 years, 2017 to 2021
- Avoidable deaths from suicide and self-inflicted injuries, people aged 45 to 74 years, 2017 to 2021
- Avoidable deaths from other external causes of mortality (Transport accidents; Accidental drowning and submersion; etc.), people aged 0 to 74 years, 2017 to 2021
- Avoidable deaths from transport accidents, people aged 0 to 74 years, 2017 to 2021
Potential years of life lost by sex, and age
- Potential years of life lost, males, females, persons (deaths before 75 years of age), and by broad age group, 2017 to 2021
Avoidable mortality by selected cause
- Potential years of life lost from cancer (deaths before 75 years of age), 2017 to 2021
- Potential years of life lost from colorectal cancer (deaths before 75 years of age), 2017 to 2021
- Potential years of life lost from lung cancer (deaths before 75 years of age), 2017 to 2021
- Potential years of life lost from breast cancer (deaths before 75 years of age), 2017 to 2021
- Potential years of life lost from diabetes (deaths before 75 years of age), 2017 to 2021
- Potential years of life lost from circulatory system diseases (deaths before 75 years of age), 2017 to 2021
- Potential years of life lost from ischaemic heart disease (deaths before 75 years of age), 2017 to 2021
- Potential years of life lost from cerebrovascular diseases (deaths before 75 years of age), 2017 to 2021
- Potential years of life lost from respiratory system diseases (deaths before 75 years of age), 2017 to 2021
- Potential years of life lost from chronic obstructive pulmonary disease (deaths before 75 years of age), 2017 to 2021
- Potential years of life lost from external causes (deaths before 75 years of age), 2017 to 2021
- Potential years of life lost from road traffic injuries (deaths before 75 years of age), 2017 to 2021
- Potential years of life lost from suicide and self-inflicted injuries (deaths before 75 years of age), 2017 to 2021
Aged care places
- Residential aged care places, 30 June 2023
Admissions by hospital type and sex (excluding same-day admissions for renal dialysis)
- Male total admissions - Public, All hospitals, 2020/21
- Female total admissions - Public, All hospitals, 2020/21
- Total admissions - Public, Private, All hospitals, 2020/21
Admissions by principal diagnosis, Public hospitals - Males, Females, Persons
- Infectious and parasitic diseases, 2020/21
- All cancers, 2020/21
- Endocrine, nutritional and metabolic diseases, 2020/21
- Diabetes, 2020/21
- Mental health-related conditions, 2020/21
- Mood affective disorders, 2020/21
- Nervous system diseases, 2020/21
- Eye and adnexa diseases, 2020/21
- Ear and mastoid process diseases, 2020/21
- Circulatory system diseases, 2020/21
- Ischaemic heart disease, 2020/21
- Heart failure, 2020/21
- Stroke, 2020/21
- Respiratory system diseases, 2020/21
- Asthma, 2020/21
- Chronic obstructive pulmonary disease (COPD), 2020/21
- Digestive system diseases, 2020/21
- Skin and subcutaneous tissue diseases, 2020/21
- Musculoskeletal system and connective tissue diseases, 2020/21
- Genitourinary system diseases, 2020/21
- Chronic kidney disease, 2020/21
- Pregnancy and childbirth 15 to 44 years (Females only), 2020/21
- Certain conditions originating in the perinatal period (Persons only), 2020/21
- Congenital malformations, deformations and chromosomal abnormalities, 2020/21
- Injury, poisoning and other external causes, 2020/21
Admissions by principal diagnosis of injury or poisoning by external cause, Public hospitals - Males, Females, Persons
- Transport crash Injury, 2020/21
- Accidental poisoning (Persons only), 2020/21
- Falls, 2020/21
- Injury due to exposure to inanimate mechanical forces, 2020/21
- Injury due to exposure to animate mechanical forces, 2020/21
- Intentional self-harm, 2020/21
- Assault, 2020/21
- All diagnosis of injury or poisoning, by external cause, 2020/21
Admissions by procedure
- Tonsillectomy - Public, Private, All hospitals, 2020/21
- Myringotomy, 0 to 9 years - Public, Private, All hospitals, 2020/21
- Hysterectomy, females aged 30 to 59 years - Public, Private, All hospitals, 2020/21
- Caesarean section, females aged 15 to 44 years - Public, Private, All hospitals, 2020/21
- Hip fracture - Public, Private, All hospitals, 2020/21
- Fibre optic colonoscopy - Public, Private, All hospitals, 2020/21
- Fibre optic colonoscopy excision - Public, Private, All hospitals, 2020/21
Same-day admissions for renal dialysis, Public hospitals
- Same-day dialysis for kidney disease, 2020/21
Potentially preventable hospitalisations, Public hospitals - by broad age groups
- Potentially preventable conditions, by broad age groups, 2020/21
Potentially preventable hospitalisations, Public hospitals - Vaccine-preventable conditions
- Vaccine-preventable conditions - pneumonia and influenza, 2020/21
- Total vaccine-preventable conditions, 2020/21
Potentially preventable hospitalisations, Public hospitals - Acute conditions
- Acute cellulitis, 2020/21
- Acute convulsions and epilepsy, 2020/21
- Acute dental conditions, 2020/21
- Acute ear, nose and throat infections, 2020/21
- Acute gangrene, 2020/21
- Acute urinary tract infections, including pyelonephritis, 2020/21
- Total acute conditions, 2020/21
Potentially preventable hospitalisations, Public hospitals - Chronic conditions
- Chronic angina, 2020/21
- Chronic asthma, 2020/21
- Chronic congestive cardiac failure, 2020/21
- Chronic obstructive pulmonary disease (COPD), 2020/21
- Chronic diabetes complications, 2020/21
- Chronic hypertension, 2020/21
- Chronic iron deficiency anaemia, 2020/21
- Total chronic conditions, 2020/21
Emergency department presentations, by sex
- Male, Female, Total presentations, 2020/21
Emergency department presentations, by age and sex
- Male, Female, Total presentations, by broad age group, 2020/21
Emergency department presentations, by triage category
- Resuscitation presentations, 2020/21
- Emergency presentations, 2020/21
- Urgent presentations, 2020/21
- Semi-urgent presentations, 2020/21
- Non-urgent presentations, 2020/21
- Total presentations, 2020/21
Emergency department presentations, by principal diagnosis
- Certain infectious and parasitic diseases, 2020/21
- Mental and behavioural disorders, 2020/21
- Diseases of the circulatory system, 2020/21
- Diseases of the respiratory system, 2020/21
- Diseases of the digestive system, 2020/21
- Diseases of the musculoskeletal system and connective tissue, 2020/21
- Diseases of the genitourinary system, 2020/21
- Injury, poisoning and certain other consequences of external causes, 2020/21
- Factors influencing health status and contact with health services, 2020/21
- Other diseases/ conditions, 2020/21
- Total presentations, 2020/21
Emergency department presentations for certain infectious and parasitic diseases, by age
- Total presentations, by broad age group, 2020/21
Emergency department presentations for mental and behavioural disorders, by age
- Total presentations, by broad age group, 2020/21
Emergency department presentations for diseases of the circulatory system, by age
- Total presentations, by broad age group, 2020/21
Emergency department presentations for diseases of the respiratory system, by age
- Total presentations, by broad age group, 2020/21
Emergency department presentations for diseases of the digestive system, by age
- Total presentations, by broad age group, 2020/21
Emergency department presentations for diseases of the musculoskeletal system and connective tissue, by age
- Total presentations, by broad age group, 2020/21
Emergency department presentations for diseases of the genitourinary system, by age and sex
- Male, Female, Total presentations, by broad age group, 2020/21
Emergency department presentations for injury, poisoning and certain other consequences of external causes, by age and sex
- Male, Female, Total presentations, by broad age group, 2020/21
Emergency department presentations for factors influencing health status and contact with health services, by age
- Total presentations, by broad age group, 2020/21
Click hereto access the maps for these atlases.
Click hereto access the graphs for these atlases.
Click hereto access the data for these atlases.
Data release: By Indigenous Area, Primary Health Networks, quintile of Indigenous Relative Socioeconomic Outcomes and Remoteness Areas
Aboriginal & Torres Strait Islander Social Health Atlases of Australia
Aboriginal age distribution - estimated resident population (erp)
- Age distribution - 5 year age groups, and broad age groups: Aboriginal Males, Females, Persons (erp), 2021
Aboriginal population as a proportion of the total population, erp
- Aboriginal population, and Aboriginal population: 5 year age groups, 2021
Summary measure of Indigenous outcomes
- Indigenous Relative Socioeconomic Outcomes, 2021
Click hereto access the maps for these atlases.
Click hereto access the graphs for these atlases.
Click hereto access the data for these atlases.
Data release: Indigenous Status Comparison: Social Health Atlas of Australia
The Indigenous Status Comparison: Social Health Atlas of Australia, presents selected topics and compares indicators between Indigenous and Non-Indigenous populations in Australia. This is available by Indigenous Areas, including total for the Greater Capital City Statistical Areas/Rest of States/NT; and States/Territories.
The topics and indicators in this latest release are listed below.
Age distribution - estimated resident population (erp)
- Age distribution - Indigenous/ Non-Indigenous: 5 year age groups, males, females, persons (erp), 2021
Indigenous status
- Indigenous/ Non-Indigenous population as a proportion of estimated resident population (erp), 2021
Click hereto access the maps for these atlases.
Click hereto access the graphs for these atlases.
Click hereto access the data for these atlases.
Fact sheet release: 24 November 2023
Long-term health conditions: variations in the number and type of conditions reported, by Indigenous status
The release by the Australian Bureau of Statistics of data from the 2021 Census of Population and Housing for long-term health conditions provides the opportunity to examine variations in the number and type of conditions by Indigenous status.
Click here to access the Fact Sheet.
Fact sheet release: 26 October 2023
Long-term health conditions: variations in the number and type of conditions reported by Aboriginal and Torres Strait Islander people - Amended 2023
This Fact Sheet updates the version published in June 2023 (Long-term health conditions: variations in the number and type of conditions reported by Aboriginal and Torres Strait Islander people) where preliminary estimated resident population (ERP) by Remoteness Area (Table 2) has been replaced with Final ERP.
Click here to access the Fact Sheet.
Data release: 9 October 2023
Data release: Indigenous Status Comparison: Social Health Atlas of Australia
The Indigenous Status Comparison: Social Health Atlas of Australia, presents selected topics and compares indicators between Indigenous and Non-Indigenous populations in Australia. This is available by Indigenous Areas, including total for the Greater Capital City Statistical Areas/Rest of States/NT; and States/Territories.
The topics and indicators in this latest release are listed below.
Age distribution, usual resident population (URP)
- Indigenous/ Non-Indigenous: 5 year age groups, males, females, persons, 2021
Indigenous status
- Indigenous/ Non-Indigenous population as a proportion of total usual resident population, 2021
Indigenous status by age
- Indigenous/ Non-Indigenous population by age group as a proportion of total usual resident population, 2021
Education
- Preschool enrolments: Indigenous/ Non-Indigenous children aged 4 or 5 years old, 2021
- Preschool attendance: Indigenous/ Non-Indigenous children aged 4 or 5 years old, 2021
- Indigenous/ Non-Indigenous people who left school at Year 10 or below, or did not go to school, 2021
- Indigenous/ Non-Indigenous people at age 16 in full-time secondary school education, 2021
- Participation of Indigenous/ Non-Indigenous people in vocational education and training, 2021
- Subject completion rates in vocational education and training, Indigenous/ Non-Indigenous students, 2021
Early childhood development: Australian Early Development Census (AEDC)
- Indigenous/ Non-Indigenous children developmentally vulnerable on one or more domains, 2021
- Indigenous/ Non-Indigenous children developmentally vulnerable on two or more domains, 2021
- Physical health and wellbeing domain - Indigenous/ Non-Indigenous children developmentally vulnerable/ at risk/ on track, 2021
- Social competence domain - Indigenous/ Non-Indigenous children developmentally vulnerable/ at risk/ on track, 2021
- Emotional maturity - Indigenous/ Non-Indigenous children developmentally vulnerable/ at risk/ on track, 2021
- Language and cognitive skills (school-based) domain - Indigenous/ Non-Indigenous children developmentally vulnerable/ at risk/ on track, 2021
- Communication skills and general knowledge domain - Indigenous/ Non-Indigenous children developmentally vulnerable/ at risk/ on track, 2021
- Physical readiness for school day - Indigenous/ Non-Indigenous children developmentally vulnerable, 2021
- Physical independence - Indigenous/ Non-Indigenous children developmentally vulnerable, 2021
- Gross and fine motor skills - Indigenous/ Non-Indigenous children developmentally vulnerable, 2021
Learning or earning
- Indigenous/ Non-Indigenous people learning or earning at ages 15 to 24, 2021
Families
- Indigenous/ Non-Indigenous single parent families with children aged less than 15 years, 2021
- Indigenous/ Non-Indigenous jobless families with children aged less than 15 years, 2021
- Indigenous/ Non-Indigenous children aged less than 15 years in jobless families, 2021
- Indigenous/ Non-Indigenous children aged less than 15 years living in families where the female parent’s highest level of schooling was year 10 or below, or where the female parent did not attend school, 2021
Housing
- Indigenous/ Non-Indigenous people living in dwellings requiring extra bedrooms, 2021
- Indigenous/ Non-Indigenous people living in dwellings requiring four or more extra bedrooms, 2021
- Private dwellings with Indigenous/ Non-Indigenous households requiring one or more extra bedrooms, 2021
- Indigenous/ Non-Indigenous households renting privately-owned dwellings, 2021
- Indigenous/ Non-Indigenous households renting from a government housing authority, 2021
- Indigenous/ Non-Indigenous households renting from a community housing group, 2021
- Total Indigenous/ Non-Indigenous households renting social housing, 2021
- Indigenous/ Non-Indigenous people living in rented social housing dwellings, 2021
- Indigenous/ Non-Indigenous people living in privately-owned rental dwellings, 2021
- Indigenous/ Non-Indigenous low income households (households in bottom 40% of income distribution) with mortgage stress , 2021
- Indigenous/ Non-Indigenous low income households (households in bottom 40% of income distribution) with rental stress , 2021
- Indigenous/ Non-Indigenous low income households (households in bottom 40% of income distribution under financial stress from mortgage or rent , 2021
- Indigenous/ Non-Indigenous low income households (households in bottom 40% of income distribution), 2021
Labour force
- Indigenous/ Non-Indigenous unemployment, 2021
- Indigenous/ Non-Indigenous labour force participation, 2021
- Indigenous/ Non-Indigenous female labour force participation, 2021
Immunisation
- Indigenous/ Non-Indigenous children fully immunised at 1 year of age, 2021
- Indigenous/ Non-Indigenous children fully immunised at 2 years of age, 2021
- Indigenous/ Non-Indigenous children fully immunised at 5 years of age, 2021
Long-term health conditions (ABS Census) - All ages
- Indigenous/ Non-Indigenous people who reported they had one long-term health condition, 2021
- Indigenous/ Non-Indigenous people who reported they had two long-term health conditions, 2021
- Indigenous/ Non-Indigenous people who reported they had three or more long-term health conditions, 2021
- Indigenous/ Non-Indigenous people who reported they had one or more long-term health conditions, 2022
Long-term health conditions (ABS Census) - Adults (15 years and over)
- Indigenous/ Non-Indigenous people aged 15 years and over who reported they had one long-term health condition, 2021
- Indigenous/ Non-Indigenous people aged 15 years and over who reported they had two long-term health conditions, 2021
- Indigenous/ Non-Indigenous people aged 15 years and over who reported they had three or more long-term health conditions, 2021
- Indigenous/ Non-Indigenous people aged 15 years and over who reported they had one or more long-term health conditions, 2022
Long-term health conditions (ABS Census) - Children and young people (0 to 14 years)
- Indigenous/ Non-Indigenous people aged 0 to 14 years who reported they had one long-term health condition, 2021
- Indigenous/ Non-Indigenous people aged 0 to 14 years who reported they had two long-term health conditions, 2021
- Indigenous/ Non-Indigenous people aged 0 to 14 years who reported they had one or more long-term health conditions, 2021
Long-term health conditions by condition (ABS Census) - Adults (15 years and over)
- Indigenous/ Non-Indigenous people aged 15 years and over who reported they had arthritis, 2021
- Indigenous/ Non-Indigenous people aged 15 years and over who reported they had asthma, 2021
- Indigenous/ Non-Indigenous people aged 15 years and over who reported they had cancer (including remission), 2021
- Indigenous/ Non-Indigenous people aged 15 years and over who reported they had dementia (including Alzheimer's), 2021
- Indigenous/ Non-Indigenous people aged 15 years and over who reported they had diabetes (excluding gestational diabetes), 2021
- Indigenous/ Non-Indigenous people aged 15 years and over who reported they had heart disease (including heart attack or angina), 2021
- Indigenous/ Non-Indigenous people aged 15 years and over who reported they had kidney disease, 2021
- Indigenous/ Non-Indigenous people aged 15 years and over who reported they had a lung condition (including COPD or emphysema), 2021
- Indigenous/ Non-Indigenous people aged 15 years and over who reported they had a mental health condition (including depression or anxiety), 2021
- Indigenous/ Non-Indigenous people aged 15 years and over who reported they had a stroke, 2021
- Indigenous/ Non-Indigenous people aged 15 years and over who reported they had any other long term health conditions, 2021
Long-term health conditions by condition (ABS Census) - Children and young people (0 to 14 years)
- Indigenous/ Non-Indigenous people aged 0 to 14 years who reported they had asthma, 2021
- Indigenous/ Non-Indigenous people aged 0 to 14 years who reported they had a mental health condition (including depression or anxiety), 2021
- Indigenous/ Non-Indigenous people aged 0 to 14 years who reported they had any other long term health conditions, 2021
Disability
- Indigenous/ Non-Indigenous people aged 15 years and over who provided unpaid assistance to people with a disability, 2021
- Indigenous/ Non-Indigenous people with a profound or severe disability (includes people in long-term accommodation), 2021
- Indigenous/ Non-Indigenous people with a profound or severe disability and living in households, 2021
- Indigenous/ Non-Indigenous people aged 0 to 64 years and over with a profound or severe disability (includes people in long-term accommodation), 2021
- Indigenous/ Non-Indigenous people aged 0 to 64 years with a profound or severe disability and living in households, 2021
- Indigenous/ Non-Indigenous people aged 65 years and over with a profound or severe disability (includes people in long-term accommodation), 2021
- Indigenous/ Non-Indigenous people aged 65 years and over with a profound or severe disability and living in households, 2021
Admissions by sex (excluding same-day admissions for renal dialysis)
- Male total admissions, Indigenous/ Non-Indigenous, 2017/18 to 2019/20
- Female total admissions, Indigenous/ Non-Indigenous, 2017/18 to 2019/20
- Total admissions, Indigenous/ Non-Indigenous, 2017/18 to 2019/20
Admissions by age (excluding same-day admissions for renal dialysis)
- Total admissions, people aged 0 to 14 years, Indigenous/ Non-Indigenous population, 2017/18 to 2019/20
- Total admissions, people aged 15 to 24 years, Indigenous/ Non-Indigenous population, 2017/18 to 2019/20
- Total admissions, people aged 25 to 44 years, Indigenous/ Non-Indigenous population, 2017/18 to 2019/20
- Total admissions, people aged 45 to 64 years, Indigenous/ Non-Indigenous population, 2017/18 to 2019/20
- Total admissions, people aged 65 years and over, Indigenous/ Non-Indigenous population, 2017/18 to 2019/20
Admissions by selected principal diagnosis
- Infectious and parasitic diseases, Indigenous/ Non-Indigenous population, 2017/18 to 2019/20
- Cancer, Indigenous/ Non-Indigenous population, 2017/18 to 2019/20
- Endocrine, nutritional and metabolic diseases, Indigenous/ Non-Indigenous population, 2017/18 to 2019/20
- Diabetes, Indigenous/ Non-Indigenous population, 2017/18 to 2019/20
- Mental health-related conditions, Indigenous/ Non-Indigenous population, 2017/18 to 2019/20
- Mood affective disorders, Indigenous/ Non-Indigenous population, 2017/18 to 2019/20
- Nervous system diseases, Indigenous/ Non-Indigenous population, 2017/18 to 2019/20
- Eye and adnexa diseases, Indigenous/ Non-Indigenous population, 2017/18 to 2019/20
- Ear and mastoid process diseases, Indigenous/ Non-Indigenous population, 2017/18 to 2019/20
- Circulatory system diseases, Indigenous/ Non-Indigenous population, 2017/18 to 2019/20
- Ischaemic heart disease, Indigenous/ Non-Indigenous population, 2017/18 to 2019/20
- Heart failure, Indigenous/ Non-Indigenous population, 2017/18 to 2019/20
- Respiratory system diseases, Indigenous/ Non-Indigenous population, 2017/18 to 2019/20
- Asthma, Indigenous/ Non-Indigenous population, 2017/18 to 2019/20
- Chronic obstructive pulmonary disease (COPD), Indigenous/ Non-Indigenous population, 2017/18 to 2019/20
- Digestive system diseases, Indigenous/ Non-Indigenous population, 2017/18 to 2019/20
- Skin and subcutaneous tissue diseases, Indigenous/ Non-Indigenous population, 2017/18 to 2019/20
- Musculoskeletal system and connective tissue diseases, Indigenous/ Non-Indigenous population, 2017/18 to 2019/20
- Genitourinary system diseases, Indigenous/ Non-Indigenous population, 2017/18 to 2019/20
- Chronic kidney disease, Indigenous/ Non-Indigenous population, 2017/18 to 2019/20
- Pregnancy, childbirth and the puerperium, females aged 15 to 44 years, Indigenous/ Non-Indigenous, 2017/18 to 2019/20
- Congenital malformations, deformations and chromosomal abnormalities, Indigenous/ Non-Indigenous population, 2017/18 to 2019/20
- Injury, poisoning and other external causes, Indigenous/ Non-Indigenous population, 2017/18 to 2019/20
Admissions by selected principal diagnosis and age
- Infectious and parasitic diseases aged 0 to 14 years, Indigenous/ Non-Indigenous population, 2017/18 to 2019/20
- Infectious and parasitic diseases aged 15 years and over, Indigenous/ Non-Indigenous population, 2017/18 to 2019/20
- Respiratory system diseases aged 0 to 14 years, Indigenous/ Non-Indigenous population, 2017/18 to 2019/20
- Respiratory system diseases aged 15 years and over, Indigenous/ Non-Indigenous population, 2017/18 to 2019/20
- Digestive system diseases aged 0 to 14 years, Indigenous/ Non-Indigenous population, 2017/18 to 2019/20
- Digestive system diseases aged 15 years and over, Indigenous/ Non-Indigenous population, 2017/18 to 2019/20
- Skin and subcutaneous tissue diseases aged 0 to 14 years, Indigenous/ Non-Indigenous population, 2017/18 to 2019/20
- Skin and subcutaneous tissue diseases aged 15 years and over, Indigenous/ Non-Indigenous population, 2017/18 to 2019/20
- Injury, poisoning and other external causes aged 0 to 14 years, Indigenous/ Non-Indigenous population, 2017/18 to 2019/20
- Injury, poisoning and other external causes aged 15 years and over, Indigenous/ Non-Indigenous population, 2017/18 to 2019/20
Admissions by principal diagnosis of injury or poisoning, by external cause
- Transport crash injury, Indigenous/ Non-Indigenous population, 2017/18 to 2019/20
- Falls, Indigenous/ Non-Indigenous population, 2017/18 to 2019/20
- Injury due to exposure to inanimate mechanical forces, Indigenous/ Non-Indigenous population, 2017/18 to 2019/20
- Injury due to exposure to animate mechanical forces, Indigenous/ Non-Indigenous population, 2017/18 to 2019/20
- Intentional self-harm, Indigenous/ Non-Indigenous population, 2017/18 to 2019/20
- Assault, Indigenous/ Non-Indigenous population, 2017/18 to 2019/20
- Total diagnosis of injury or poisoning, by external cause, Indigenous/ Non-Indigenous population, 2017/18 to 2019/20
Same-day admissions for renal dialysis
- Same-day admissions for dialysis for kidney disease, Indigenous/ Non-Indigenous population, 2017/18 to 2019/20
Potentially preventable hospitalisations by age
- Potentially preventable conditions aged 0 to 14 years, Indigenous/ Non-Indigenous population, 2017/18 to 2019/20
- Potentially preventable conditions aged 15 to 24 years, Indigenous/ Non-Indigenous population, 2017/18 to 2019/20
- Potentially preventable conditions aged 25 to 44 years, Indigenous/ Non-Indigenous population, 2017/18 to 2019/20
- Potentially preventable conditions aged 45 to 64 years, Indigenous/ Non-Indigenous population, 2017/18 to 2019/20
- Potentially preventable conditions aged 65 years and over, Indigenous/ Non-Indigenous population, 2017/18 to 2019/20
- Potentially preventable conditions, total, Indigenous/ Non-Indigenous population, 2017/18 to 2019/20
Potentially preventable hospitalisations - Vaccine-preventable conditions
- Vaccine-preventable conditions - pneumonia and influenza, Indigenous/ Non-Indigenous population, 2017/18 to 2019/20
- Total Vaccine-preventable conditions, Indigenous/ Non-Indigenous population, 2017/18 to 2019/20
Potentially preventable hospitalisations - Acute conditions
- Acute cellulitis, Indigenous/ Non-Indigenous population, 2017/18 to 2019/20
- Acute convulsions and epilepsy, Indigenous/ Non-Indigenous population, 2017/18 to 2019/20
- Acute dental conditions, Indigenous/ Non-Indigenous population, 2017/18 to 2019/20
- Acute ear, nose and throat infections, Indigenous/ Non-Indigenous population, 2017/18 to 2019/20
- Acute urinary tract infections, including pyelonephritis, Indigenous/ Non-Indigenous population, 2017/18 to 2019/20
- Total acute conditions, Indigenous/ Non-Indigenous population, 2017/18 to 2019/20
Potentially preventable hospitalisations - Chronic conditions
- Chronic angina, Indigenous/ Non-Indigenous population, 2017/18 to 2019/20
- Chronic asthma, Indigenous/ Non-Indigenous population, 2017/18 to 2019/20
- Chronic congestive cardiac failure, Indigenous/ Non-Indigenous population, 2017/18 to 2019/20
- Chronic obstructive pulmonary disease (COPD), Indigenous/ Non-Indigenous population, 2017/18 to 2019/20
- Chronic diabetes complications, Indigenous/ Non-Indigenous population, 2017/18 to 2019/20
- Chronic iron deficiency anaemia, Indigenous/ Non-Indigenous population, 2017/18 to 2019/20
- Total chronic conditions, Indigenous/ Non-Indigenous population, 2017/18 to 2019/21
Emergency department presentations, by triage category
- Resuscitation and emergency presentations, Indigenous/ Non-Indigenous population, 2017/18 to 2019/20
- Urgent presentations, Indigenous/ Non-Indigenous population, 2017/18 to 2019/20
- Semi-urgent presentations, Indigenous/ Non-Indigenous population, 2017/18 to 2019/20
- Non-urgent presentations, Indigenous/ Non-Indigenous population, 2017/18 to 2019/20
- Total presentations, Indigenous/ Non-Indigenous population, 2017/18 to 2019/20
Emergency department presentations, by principal diagnosis
- Total presentations for certain infectious and parasitic diseases, Indigenous/ Non-Indigenous population, 2017/18 to 2019/20
- Total presentations for mental and behavioural disorders, Indigenous/ Non-Indigenous population, 2017/18 to 2019/20
- Total presentations for diseases of the circulatory system, Indigenous/ Non-Indigenous population, 2017/18 to 2019/20
- Total presentations for diseases of the respiratory system, Indigenous/ Non-Indigenous population, 2017/18 to 2019/20
- Total presentations for diseases of the digestive system, Indigenous/ Non-Indigenous population, 2017/18 to 2019/20
- Total presentations for diseases of the musculoskeletal system and connective tissue, Indigenous/ Non-Indigenous population, 2017/18 to 2019/20
- Total presentations for diseases of the genitourinary system, Indigenous/ Non-Indigenous population, 2017/18 to 2019/20
- Total presentations for injury, poisoning and certain other consequences of external causes, Indigenous/ Non-Indigenous population, 2017/18 to 2019/20
- Total presentations for factors influencing health status and contact with health services, Indigenous/ Non-Indigenous population, 2017/18 to 2019/20
- Total presentations, Indigenous/ Non-Indigenous population, 2017/18 to 2019/20
Emergency department presentations - urgent, by principal diagnosis
- Urgent presentations for diseases of the respiratory system, Indigenous/ Non-Indigenous population, 2017/18 to 2019/20
- Urgent presentations for injury, poisoning and certain other consequences of external causes, Indigenous/ Non-Indigenous population, 2017/18 to 2019/20
- Total urgent presentations, Indigenous/ Non-Indigenous population, 2017/18 to 2019/20
Emergency department presentations - resuscitation, emergency and urgent, by principal diagnosis
- Resuscitation, emergency and urgent presentations for certain infectious and parasitic diseases, Indigenous/ Non-Indigenous population, 2017/18 to 2019/20
- Resuscitation, emergency and urgent presentations for mental and behavioural disorders, Indigenous/ Non-Indigenous population, 2017/18 to 2019/20
- Resuscitation, emergency and urgent presentations for diseases of the digestive system, Indigenous/ Non-Indigenous population, 2017/18 to 2019/20
- Resuscitation, emergency and urgent presentations for diseases of the musculoskeletal system and connective tissue, Indigenous/ Non-Indigenous population, 2017/18 to 2019/20
- Resuscitation, emergency and urgent presentations for diseases of the genitourinary system, Indigenous/ Non-Indigenous population, 2017/18 to 2019/20
- Total resuscitation, emergency and urgent presentations, Indigenous/ Non-Indigenous population, 2017/18 to 2019/20
Emergency department presentations - semi-urgent, by principal diagnosis
- Semi-urgent presentations for injury, poisoning and certain other consequences of external causes, Indigenous/ Non-Indigenous population, 2017/18 to 2019/20
- Semi-urgent presentations for factors influencing health status and contact with health services, Indigenous/ Non-Indigenous population, 2017/18 to 2019/20
- Total semi-urgent presentations, Indigenous/ Non-Indigenous population, 2017/18 to 2019/20
Emergency department presentations - non-urgent, by principal diagnosis
- Non-urgent presentations for injury, poisoning and certain other consequences of external causes, Indigenous/ Non-Indigenous population, 2017/18 to 2019/20
- Non-urgent presentations for factors influencing health status and contact with health services, Indigenous/ Non-Indigenous population, 2017/18 to 2019/20
- Total non-urgent presentations, Indigenous/ Non-Indigenous population, 2017/18 to 2019/20
Emergency department presentations - resuscitation, emergency and urgent, by principal diagnosis
- Semi-urgent and non-urgent presentations for certain infectious and parasitic diseases, Indigenous/ Non-Indigenous population, 2017/18 to 2019/20
- Semi-urgent and non-urgent presentations for mental and behavioural disorders, Indigenous/ Non-Indigenous population, 2017/18 to 2019/20
- Semi-urgent and non-urgent presentations for diseases of the respiratory system, Indigenous/ Non-Indigenous population, 2017/18 to 2019/20
- Semi-urgent and non-urgent presentations for diseases of the digestive system, Indigenous/ Non-Indigenous population, 2017/18 to 2019/20
- Semi-urgent and non-urgent presentations for diseases of the musculoskeletal system and connective tissue, Indigenous/ Non-Indigenous population, 2017/18 to 2019/20
- Semi-urgent and non-urgent presentations for diseases of the genitourinary system, Indigenous/ Non-Indigenous population, 2017/18 to 2019/20
- Total semi-urgent and non-urgent presentations, Indigenous/ Non-Indigenous population, 2017/18 to 2019/20
Click hereto access the maps for these atlases.
Click hereto access the data for these atlases.
Data release: Aboriginal & Torres Strait Islander Social Health Atlases of Australia - Errata
Early childhood development - Errata (Indigenous Area, and Remoteness Area only)
Incorrect data were published in March 2023 for the below indicators/ geographies:
- Social competence - vulnerable, at risk and on track
- Language - vulnerable and on track; and
- Remoteness Aust/State totals for all of the domains vulnerable and on track.
These indicators have been re-released in October 2023 with the correct data
Click hereto access the maps for these atlases.
Click hereto access the data for these atlases.
Data release: 15 September 2023
Data release: By Population Health Area, Local Government Area, Primary Health Network, quintile of socioeconomic disadvantage of area (including within Primary Health Networks) and Remoteness Area
Social Health Atlases of Australia
Homelessness
- Estimated number of people experiencing homelessness, 2021
Screening ages
- People born in Australia: females aged 25 to 74 years and males/females/persons aged 50 to 74 years, 2021
Cancer incidence - Males
- Prostate cancer, 2014 to 2018
- Colorectal cancer, 2014 to 2018
- Melanoma of the skin, 2014 to 2018
- Lung cancer, 2014 to 2018
- Head and neck cancer, 2014 to 2018
- Lymphoma, 2014 to 2018
- Leukaemia, 2014 to 2018
- Bladder cancer, 2014 to 2018
- Kidney cancer, 2014 to 2018
- Pancreatic cancer, 2014 to 2018
- Stomach cancer, 2014 to 2018
- All other cancers, 2014 to 2018
- All cancers, 2014 to 2018
Cancer incidence - Females
- Breast cancer, 2014 to 2018
- Colorectal cancer, 2014 to 2018
- Melanoma of the skin, 2014 to 2018
- Lung cancer, 2014 to 2018
- Uterine cancer, 2014 to 2018
- Lymphoma, 2014 to 2018
- Thyroid cancer, 2014 to 2018
- Leukaemia, 2014 to 2018
- Ovarian cancer, 2014 to 2018
- Pancreatic cancer, 2014 to 2018
- All other cancers, 2014 to 2018
- All cancers, 2014 to 2018
Cancer incidence - Persons
- Colorectal cancer, 2014 to 2018
- Melanoma of the skin, 2014 to 2018
- Lung cancer, 2014 to 2018
- Lymphoma, 2014 to 2018
- Leukaemia, 2014 to 2018
- Pancreatic cancer, 2014 to 2018
- All other cancers, 2014 to 2018
- All cancers, 2014 to 2018
Click hereto access the maps for these atlases.
Click hereto access the graphs for these atlases.
Click hereto access the data for these atlases.
Data release: 31 August 2023
Data release: By quintile of socioeconomic disadvantage of area and Remoteness Area time series
As of this release, the graphs for all Census-derived indicators have been based on the 2021 Index of Relative Socio-economic Disadvantage, and 2021 Remoteness Areas respectively.
Social Health Atlases of Australia
Non-English-speaking countries of birth
- Top ten birthplaces of people from non-English-speaking countries, based on Australian totals: Top ten, from highest to lowest: India, China (excluding Special Administrative Regions of Hong Kong & Macau, and Taiwan), Philippines, Vietnam, Malaysia, Italy, Sri Lanka, Nepal, Korea, Republic of (South), and Germany, 2021
Fertility
- Total fertility rate, 2021
Education
- Participation in vocational education and training - Aboriginal population, 2021
- Participation in vocational education and training - Total population, 2021
- Subject completion rates in vocational education and training - Government-funded hours, 2021
- Subject completion rates in vocational education and training - Private-funded hours, 2021
- Subject completion rates in vocational education and training - Total student hours, 2021
- Subject completion rates in vocational education and training - Aboriginal student hours, 2021
Families
- Single parent families with children aged less than 15 years, 2021
- Jobless families with children aged less than 15 years, 2021
- Children aged less than 15 years in jobless families, 2021
- Children in families where the mother has low educational attainment, 2021
Child care: unpaid
- Child care to own child/children (unpaid), 2021
- Child care to other child/children (unpaid), 2021
- Total (unpaid) child care, 2021
Volunteering
- Voluntary work for an organisation or group, 2021
Housing, rent assistance and vehicle access
- Crowded housing, Persons/ Aboriginal persons living in dwellings requiring extra bedrooms, 2021
- Severely crowded dwellings, Persons/ Aboriginal persons living in dwellings requiring four or more extra bedrooms, 2021
- Housing suitability, families requiring extra bedrooms, 2021
- Privately-owned rental dwellings, 2021
- Social housing dwellings (includes housing authority and community housing dwellings), 2021
- Persons living in rented social housing dwellings, 2021
- Persons living in privately-owned rental dwellings, 2021
- Low income households with mortgage stress, 2021
- Low income households with rental stress, 2021
- Low income households under financial stress from mortgage/rent, 2021
- Low income households, 2021
- Private dwellings with no motor vehicle, 2022
Income support recipients
- Age pensioners, June 2022
- Disability support pensioners, June 2022
- Female sole parent pensioners, June 2022
- People receiving an unemployment benefit, June 2022
- Young people aged 16 to 24 receiving an unemployment benefit, June 2022
- People receiving an unemployment benefit for less than 6 months, June 2022
- People receiving an unemployment benefit for longer than 6 months, June 2022
- Low income, welfare-dependent families (with children), June 2022
- Children in low income, welfare-dependent families, June 2022
- Health Care Card holders, June 2022
- Pensioner Concession Card holders, June 2022
- Seniors Health Card holders, June 2022
Child and youth health
- Children fully immunised at 1 year of age, 2021
- Children fully immunised at 2 years of age, 2021
- Children fully immunised at 5 years of age, 2021
Disability (ABS Census)
- Assistance to people with a disability (unpaid), 2021
- Profound or severe disability (includes people in long-term accommodation), All ages, 2021
- Profound or severe disability and living in households, All ages, 2021
- Profound or severe disability (includes people in long-term accommodation), 0 to 64 years, 2021
- Profound or severe disability and living in households, 0 to 64 years, 2021
- Profound or severe disability (includes people in long-term accommodation), 65 years and over, 2021
- Profound or severe disability and living in households, 65 years and over, 2021
Click hereto access the maps for these atlases.
Click hereto access the data for these atlases.
Data release: By Indigenous Area, Primary Health Networks, quintile of Indigenous Relative Socioeconomic Outcomes and Remoteness Areas
As of the August 2023 release, the graphs for all Census-derived indicators have been based on the 2021 Remoteness Areas released in March 2023.
Aboriginal & Torres Strait Islander Social Health Atlases of Australia
Long-term health conditions (ABS Census) - All ages
- Aboriginal people who reported they had one long-term health condition, 2021
- Aboriginal people who reported they had two long-term health conditions, 2021
- Aboriginal people who reported they had three or more long-term health conditions, 2021
- Aboriginal people who reported they had one or more long-term health conditions, 2021
Long-term health conditions (ABS Census) - Adults (15 years and over)
- Aboriginal people aged 15 years and over who reported they had one long-term health condition, 2021
- Aboriginal people aged 15 years and over who reported they had two long-term health conditions, 2021
- Aboriginal people aged 15 years and over who reported they had three or more long-term health conditions, 2021
- Aboriginal people aged 15 years and over who reported they had one or more long-term health conditions, 2021
Long-term health conditions (ABS Census) - Children and young people (0 to 14 years)
- Aboriginal people aged 0 to 14 years who reported they had one long-term health condition, 2021
- Aboriginal people aged 0 to 14 years who reported they had two long-term health conditions, 2021
- Aboriginal people aged 0 to 14 years who reported they had one or more long-term health conditions, 2021
Click hereto access the maps.
Click hereto access the graphs.
Click hereto access the data.
Data release: By quintile of Indigenous Relative Socioeconomic Outcomes and Remoteness Areas time series
Aboriginal & Torres Strait Islander Social Health Atlases of Australia
Age distribution: Aboriginal people
- Broad age groups: 0-4, 5-14, 15-24, 25-44, 45-54, 55-64, 65+ years - People, usual resident population (Remoteness Areas only), 2021
Aboriginal population as a proportion of the total population
- Aboriginal population as per cent of total usual resident population, 2021
Aboriginal population by age as a proportion of the total population
- Aboriginal population as per cent of total usual resident population by 5 year age groups: 0 to 65+ years, 2021
Education
- Early school leavers - Aboriginal people who left school at Year 10 or below, or did not go to school, 2021
- Participation of Aboriginal people at age 16 in full-time secondary school education, 2021
- Aboriginal participation in vocational education and training, 2021
- Subject completion rates in vocational education and training, Aboriginal students, 2021
Learning or Earning
- Aboriginal people Learning or Earning at ages 15 to 24, 2021
Families
- Aboriginal single parent families with children aged less than 15 years, 2021
- Aboriginal jobless families with children aged less than 15 years, 2021
- Children aged less than 15 years in Aboriginal jobless families, 2021
- Children aged less than 15 years living in Aboriginal families where the female parent’s highest level of schooling was year 10 or below, or where they did not attend school, 2021
Housing, and rent assistance
- Crowded dwellings - Aboriginal people living in dwellings requiring extra bedrooms, 2021
- Severely crowded dwellings - Aboriginal people living in dwellings requiring four or more extra bedrooms, 2021
- Housing suitability - Private dwelling with Aboriginal households requiring one or more extra bedrooms, 2021
- Aboriginal households renting privately-owned dwellings, 2021
- Aboriginal households renting from a government housing authority, 2021
- Aboriginal households renting from a community housing group, 2021
- Total Aboriginal households renting social housing, 2021
- Aboriginal people living in rented social housing dwellings, 2021
- Aboriginal people living in privately-owned rental dwellings, 2021
Labour force
- Aboriginal unemployment, 2021
- Aboriginal female labour force participation, 2021
Child and youth health
- Aboriginal children fully immunised at 1 year of age, 2021
- Aboriginal children fully immunised at 2 years of age, 2021
- Aboriginal children fully immunised at 5 years of age, 2021
Disability
- Aboriginal people aged 15 years and over who provided unpaid assistance to people with a disability, 2021
Admissions by sex (excluding same-day admissions for renal dialysis)
- Male total admissions, 2017/18 to 2019/20
- Female total admissions, 2017/18 to 2019/20
- Total admissions, 2017/18 to 2019/20
Admissions by age (excluding same-day admissions for renal dialysis)
- Total admissions, aged 0 to 14 years, 2017/18 to 2019/20
- Total admissions, aged 15 to 24 years, 2017/18 to 2019/20
- Total admissions, aged 25 to 44 years, 2017/18 to 2019/20
- Total admissions, aged 45 to 64 years, 2017/18 to 2019/20
- Total admissions, aged 65 years and over, 2017/18 to 2019/20
Admissions by selected principal diagnosis
- Infectious and parasitic diseases, 2017/18 to 2019/20
- All cancers, 2017/18 to 2019/20
- Endocrine, nutritional and metabolic diseases, 2017/18 to 2019/20
- Mental health-related conditions, 2017/18 to 2019/20
- Nervous system diseases, 2017/18 to 2019/20
- Eye and adnexa diseases, 2017/18 to 2019/20
- Ear and mastoid process diseases, 2017/18 to 2019/20
- Circulatory system diseases, 2017/18 to 2019/20
- Respiratory system diseases, 2017/18 to 2019/20
- Digestive system diseases, 2017/18 to 2019/20
- Skin and subcutaneous tissue diseases, 2017/18 to 2019/20
- Musculoskeletal system and connective tissue diseases, 2017/18 to 2019/20
- Genitourinary system diseases, 2017/18 to 2019/20
- Injury, poisoning and other external causes, 2017/18 to 2019/20
Admissions by selected principal diagnosis and age
- Infectious and parasitic diseases, aged 0 to 14 years, 2017/18 to 2019/20
- Infectious and parasitic diseases, aged 15 years and over, 2017/18 to 2019/20
- Respiratory system diseases, aged 0 to 14 years, 2017/18 to 2019/20
- Respiratory system diseases, aged 15 years and over, 2017/18 to 2019/20
- Digestive system diseases, aged 0 to 14 years, 2017/18 to 2019/20
- Digestive system diseases, aged 15 years and over, 2017/18 to 2019/20
- Skin and subcutaneous tissue diseases, aged 0 to 14 years, 2017/18 to 2019/20
- Skin and subcutaneous tissue diseases, aged 15 years and over, 2017/18 to 2019/20
- Injury, poisoning and other external causes, aged 0 to 14 years, 2017/18 to 2019/20
- Injury, poisoning and other external causes, aged 15 years and over, 2017/18 to 2019/20
Same-day admissions for renal dialysis
- Same-day admissions for dialysis for kidney disease, 2017/18 to 2019/20
Potentially preventable hospitalisations by age
- Potentially preventable conditions, aged 0 to 14 years, 2017/18 to 2019/20
- Potentially preventable conditions, aged 15 to 24 years, 2017/18 to 2019/20
- Potentially preventable conditions, aged 25 to 44 years, 2017/18 to 2019/20
- Potentially preventable conditions, aged 45 to 64 years, 2017/18 to 2019/20
- Potentially preventable conditions, aged 65 years and over, 2017/18 to 2019/20
- Potentially preventable conditions, total, 2017/18 to 2019/20
Potentially preventable hospitalisations - Vaccine-preventable conditions
- Total Vaccine-preventable conditions, 2017/18 to 2019/20
Potentially preventable hospitalisations - Acute conditions
- Acute cellulitis, 2017/18 to 2019/20
- Acute convulsions and epilepsy, 2017/18 to 2019/20
- Acute dental conditions, 2017/18 to 2019/20
- Acute ear nose and throat infections, 2017/18 to 2019/20
- Total acute conditions, 2017/18 to 2019/20
Potentially preventable hospitalisations - Chronic conditions
- Chronic obstructive pulmonary disease (COPD), 2017/18 to 2019/20
- Chronic diabetes complications, 2017/18 to 2019/20
- Total chronic conditions, 2017/18 to 2019/20
Click hereto access the graphs.
Click hereto access the data.
Data release: 28 July 2023
Data release: By Population Health Area, Local Government Area, Primary Health Network, quintile of socioeconomic disadvantage of area (including within Primary Health Networks) and Remoteness Area
Social Health Atlases of Australia
Non-English-speaking residents by age and sex
- People born in predominantly non-English-speaking (NES) countries: females aged 25 to 74 years and males/females/persons aged 50 to 74 years, 2021
- People born in NES countries resident in Australia for five years or more: females aged 25 to 74 years and males/females/persons aged 50 to 74 years, 2021
- People born in NES countries resident in Australia for less than five years: females aged 25 to 74 years and males/females/persons aged 50 to 74 years, 2021
Click hereto access the maps for these atlases.
Click hereto access the data for these atlases.
Data release: 19 July 2023
Atlas
Topic-Specific Atlases - Emergency Department Presentations: identifying hotspots of inequality
Public hospital emergency departments are a key element of the Australian health system, providing care to people who need it urgently. Mapping of emergency department presentations over time in areas where patients live enables us to geographically examine the degree and persistence of the demand for, and, supply of, this essential health service across Australia. This new evidence can inform policy makers to help strengthen current health care models or help deliver alternative care options, providing pathways and solutions that are tailored and targeted to meet the needs and preferences of the underlying populations.
Click here to access the atlas.
Fact sheets
Data release: Fact sheets - Long-term health conditions: variations in the number and type of conditions reported by Aboriginal and Torres Strait Islander people
The release by the Australian Bureau of Statistics of data from the 2021 Census of Population and Housing for long-term health conditions provides the opportunity to examine variations by socioeconomic disadvantage and remoteness in the number of long-term health conditions reported by Aboriginal and Torres Strait Islander people.
Click here to access the fact sheet.
Data tools
Data release: Population pyramid tool
The population pyramid tool has been updated with the 2021 estimated resident population (ERP) for the whole population and the 2021 Usual Resident Population (URP) for the Aboriginal and Torres Strait Islander populations.
The Population pyramid generator allows you to generate population pyramids for the whole population and for the Aboriginal and Torres Strait Islander populations for a range of geographical areas
Click hereto access the tool.
Data release: 30 June 2023
As of this release, the graphs for all Census-derived indicators have been based on the 2021 Index of Relative Socio-economic Disadvantage, and 2021 Remoteness Areas respectively.
Atlases
Data release: By Population Health Area, Local Government Area, Primary Health Network, quintile of socioeconomic disadvantage of area (including within Primary Health Networks) and Remoteness Area
Social Health Atlases of Australia
Fertility rate
- Total fertility rate, 2021
Education
- Participation in vocational education and training - Aboriginal population, 2021
- Participation in vocational education and training - Total population, 2021
- Subject completion rates in vocational education and training - Government-funded hours, 2021
- Subject completion rates in vocational education and training - Private-funded hours, 2021
- Subject completion rates in vocational education and training - Total student hours, 2021
- Subject completion rates in vocational education and training - Aboriginal student hours, 2021
Housing, rent assistance and vehicle access
- Households in dwellings receiving rent assistance from the Australian Government, June 2022
- Aboriginal households in dwellings receiving rent assistance from the Australian Government, June 2022
Income support recipients
- Age pensioners, June 2022
- Disability support pensioners, June 2022
- Female sole parent pensioners, June 2022
- Unemployment beneficiaries, June 2022
- JobSeeker unemployment beneficiaries, June 2022
- Youth unemployment beneficiaries, June 2022
- Short-term unemployment beneficiaries, June 2022
- Long-term unemployment beneficiaries, June 2022
- Low income families (with children), June 2022
- Children in low income families, June 2022
- Pensioner Concession Card holders, June 2022
- Health Care Card holders, June 2022
- Seniors Health Card holders, June 2022
Labour force
- Unemployment, June 2022
- Labour force participation, June 2022
Private health insurance
- Private health insurance, 2019-20
Summary measure of disadvantage
- Summary measure of disadvantage, 2021
Child and youth health
- Children fully immunised at 1 year of age, 2021
- Children fully immunised at 2 years of age, 2021
- Children fully immunised at 5 years of age, 2021
Health workforce (Local Government Area, Primary Health Networks and Remoteness only)
- General Medical Practitioners, 2021
- Hospital Practitioners non-specialist, 2021
- Specialist Practitioners, 2021
- Specialist Practitioners in training, 2021
- Total Medical Practitioners, 2021
- Registered Nurses only, 2021
- Registered Nurses who are also Midwives, 2021
- Total Registered Nurses, 2021
- Enrolled Nurses, 2021
- Midwives (may also be a Registered Nurse or Enrolled Nurse), 2021
- Total Nurses (Registered Nurses, Enrolled Nurses or Midwives, each person only counted once), 2021
- Dentists, 2021
- Total Dental Practitioners (includes Dentists, Oral health therapists, Dental hygienists, Dental therapists and Dental prosthetists), 2021
Aged care places
- Residential aged care places, 30 June 2022
Click hereto access the maps for these atlases.
Click hereto access the data for these atlases.
Data release: By Indigenous Area, Primary Health Networks, quintile of Indigenous Relative Socioeconomic Outcomes and Remoteness Areas; and errata
Aboriginal & Torres Strait Islander Social Health Atlases of Australia
Education
- Aboriginal participation in vocational education and training, 2021
- Subject completion rates in vocational education and training, Aboriginal students, 2021
Housing, and rent assistance
- Aboriginal households in dwellings receiving rent assistance from the Australian Government, June 2022
Immunisation
- Children fully immunised at 1 year of age, 2021
- Children fully immunised at 2 years of age, 2021
- Children fully immunised at 5 years of age, 2021
Early childhood development - Errata (Indigenous Area only)
Incorrect data were published in March 2023. The “developmentally vulnerable” figures were published as “developmentally on track” and the “developmentally on track” figures were published as “developmentally vulnerable” for the following domains:
- Physical health and wellbeing
- Emotional maturity; and
- Communication skills and general knowledge.
These indicators have been re-released in June 2023 with the correct data
Click hereto access the maps for these atlases.
Click hereto access the data for these atlases.
Fact sheets
Data release: Fact sheets - Long-term health conditions
The release by the Australian Bureau of Statistics of data from the 2021 Census of Population and Housing for long-term health conditions provides the opportunity to examine variations in the number of conditions by socioeconomic disadvantage.
Click here to access the fact sheet.
The release by the Australian Bureau of Statistics of data from the 2021 Census of Population and Housing by type of long-term health condition provides the opportunity to examine variations by socioeconomic disadvantage. The data also provide, for the first time, information as to the prevalence of these conditions in the most remote areas.
Click here to access the fact sheet.
Presentation
Professor John Glover, Director of PHIDU, presented “Population health data show many changes for the better but are they equitable?” as part of Torrens University's Research and Innovation Week. The data highlights the stark differences in health outcomes for different populations across the country.
Click hereto access the presentation
Data release: 15 March 2023
Atlases
Data release: By Population Health Area, Local Government Area, Primary Health Network
Social Health Atlases of Australia
The topics and indicators in this latest release are listed below.
Aboriginal population
- Aboriginal males, females, persons: 5 year age groups, 2021 usual resident population (URP)
Aboriginal population as a proportion of the total population
- Aboriginal population as per cent of total, 2021 usual resident population (URP)
- Aboriginal population as per cent of total, 2021 (URP) by 5 year age group
Housing
- Low income households with mortgage stress, 2021
- Low income households with rental stress, 2021
- Low income households under financial stress from mortgage/rent, 2021
- Low income households, 2021 - by PHA, LGA, PHN
Bowel screening
- Total males who participated in the National Bowel Cancer Screening Program, 2018 and 2019 - by PHA, LGA, PHN
- Total females who participated in the National Bowel Cancer Screening Program, 2018 and 2019 - by PHA, LGA, PHN
- Total persons who participated in the National Bowel Cancer Screening Program, 2018 and 2019 - by PHA, LGA, PHN
- National Bowel Cancer Screening Program: positive screening result, males, 2018 and 2019 - by PHA, LGA, PHN
- National Bowel Cancer Screening Program: positive screening result, females, 2018 and 2019 - by PHA, LGA, PHN
- National Bowel Cancer Screening Program: positive screening result, persons, 2018 and 2019 - by PHA, LGA, PHN
Breast screening
- Breast screening participation, females aged 50 to 74 years, 2018 and 2019, and 2019 and 2020 - by PHA, LGA, PHN
- Breast screening outcomes - cancer, females aged 50 to 74 years, 2018 and 2019, and 2019 and 2020 - by PHA, LGA, PHN
Cervical screening
- Cervical screening participation, females aged 25 to 74 years, 2018, 2019 and 2020 - by PHA, LGA, PHN
- Cervical screening outcomes - abnormality, females aged 25 to 74 years, 2018, 2019 and 2020 - by PHA, LGA, PHN
Data release: By quintile of socioeconomic disadvantage of area (including within Primary Health Networks) and Remoteness Area
Social Health Atlases of Australia
The topics and indicators in this latest release are listed below.
Aboriginal population
- Aboriginal males, females, persons: broad age groups, 2021 usual resident population (URP) Remoteness only
Aboriginal population as a proportion of the total population
- Aboriginal population as per cent of total, 2021 usual resident population (URP)
- Aboriginal population as per cent of total, 2021 (URP) by 5 year age group
Housing
- Low income households with mortgage stress, 2021
- Low income households with rental stress, 2021
- Low income households under financial stress from mortgage/rent, 2021
- Low income households, 2021 - by PHA, LGA, PHN
Bowel screening
- Total males who participated in the National Bowel Cancer Screening Program, 2018 and 2019 - by PHA, LGA, PHN
- Total females who participated in the National Bowel Cancer Screening Program, 2018 and 2019 - by PHA, LGA, PHN
- Total persons who participated in the National Bowel Cancer Screening Program, 2018 and 2019 - by PHA, LGA, PHN
- National Bowel Cancer Screening Program: positive screening result, males, 2018 and 2019 - by PHA, LGA, PHN
- National Bowel Cancer Screening Program: positive screening result, females, 2018 and 2019 - by PHA, LGA, PHN
- National Bowel Cancer Screening Program: positive screening result, persons, 2018 and 2019 - by PHA, LGA, PHN
Breast screening
- Breast screening participation, females aged 50 to 74 years, 2018 and 2019, and 2019 and 2020 - by PHA, LGA, PHN
- Breast screening outcomes - cancer, females aged 50 to 74 years, 2018 and 2019, and 2019 and 2020 - by PHA, LGA, PHN
Cervical screening
- Cervical screening participation, females aged 25 to 74 years, 2018, 2019 and 2020 - by PHA, LGA, PHN
- Cervical screening outcomes - abnormality, females aged 25 to 74 years, 2018, 2019 and 2020 - by PHA, LGA, PHN
Data release: By Indigenous Area, Primary Health Networks, quintile of Indigenous Relative Socioeconomic Outcomes and Remoteness Areas
Social Health Atlases of Australia
The topics and indicators in this latest release are listed below.
Age distribution
- Aboriginal males, females, persons: 5 year age groups, 2021 usual resident population (URP)
Aboriginal population as a proportion of the total population
- Aboriginal population as per cent of total, 2021 usual resident population (URP)
- Aboriginal population as per cent of total, 2021 (URP) by 5 year age group
Education
- Preschool enrolments: Aboriginal children aged 4 or 5 years, 2021
- Preschool attendance: Aboriginal children aged 4 or 5 years, 2021
- Aboriginal early school leavers - people who left school at Year 10 or below, or did not go to school, 2021
- Aboriginal participation in full-time secondary school education at age 16, 2021
Early childhood development
Not available by quintile of Indigenous Relative Socioeconomic Outcomes
- Australian Early Development Census (AEDC): Developmentally vulnerable on one or more domains (Aboriginal children), 2021
- Australian Early Development Census: Developmentally vulnerable on two or more domains (Aboriginal children), 2021
- Australian Early Development Census: Developmentally vulnerable on all five domains (Aboriginal children) 2021 - by PHA, LGA, PHN
- Australian Early Development Census: Physical health and wellbeing domain - developmentally vulnerable/ at risk/ on track (Aboriginal children), 2021
- Australian Early Development Census: Social competence domain - developmentally vulnerable/ at risk/ on track (Aboriginal children), 2021
- Australian Early Development Census: Emotional maturity domain - developmentally vulnerable/ at risk/ on track (Aboriginal children), 2021
- Australian Early Development Census: Language and cognitive skills (school-based) domain - developmentally vulnerable/ at risk/ on track (Aboriginal children), 2021
- Australian Early Development Census: Communication skills and general knowledge domain - developmentally vulnerable/ at risk/ on track (Aboriginal children), 2021
- Australian Early Development Census: Physical readiness for school day - developmentally vulnerable (Aboriginal children), 2021
- Australian Early Development Census: Physical independence - developmentally vulnerable (Aboriginal children), 2021
- Australian Early Development Census: Gross and fine motor skills - developmentally vulnerable (Aboriginal children), 2021
Earning or Learning
- Aboriginal persons Learning or Earning at ages 15 to 24, 2021
Families
- Aboriginal single parent families with children aged less than 15 years, 2021
- Aboriginal jobless families with children aged less than 15 years, 2021
- Children aged less than 15 years in Aboriginal jobless families, 2021
- Aboriginal children in Aboriginal families where the mother has low educational attainment, 2021
Housing
- Aboriginal persons living in crowded dwellings, 2021
- Aboriginal persons living in severely crowded dwellings, 2021
- Private dwellings with Aboriginal households requiring one or more extra bedrooms, 2021
- Privately-owned rental dwellings (with Aboriginal households), 2021
- Private dwellings rented by Aboriginal households from the government housing authority, 2021
- Private dwellings rented by Aboriginal households from a community housing group, 2021
- Total Aboriginal social housing, 2021
- Social housing (Aboriginal persons in rented dwellings), 2021
- Privately-owned rented dwellings (Aboriginal persons), 2021
- Aboriginal low income households with mortgage stress, 2021
- Aboriginal low income households with rental stress, 2021
- Aboriginal low income households under financial stress from mortgage/rent, 2021
Labour force
- Aboriginal unemployment, 2021
- Aboriginal labour force participation, 2021
- Aboriginal female labour force participation, 2021
Long-term health conditions, by condition (ABS Census)
All ages, Aboriginal persons
- Arthritis, 2021
- Asthma, 2021
- Cancer (including remission), 2021
- Dementia (including Alzheimer's), 2021
- Diabetes (excluding gestational diabetes), 2021
- Heart disease (including heart attack or angina), 2021
- Kidney disease, 2021
- Lung condition (including COPD or emphysema), 2021
- Mental health condition (including depression or anxiety), 2021
- Stroke, 2021
- Any other long term health conditions, 2021
Adults (15 years and over), Aboriginal persons
- Arthritis, 2021
- Asthma, 2021
- Cancer (including remission), 2021
- Dementia (including Alzheimer's), 2021
- Diabetes (excluding gestational diabetes), 2021
- Heart disease (including heart attack or angina), 2021
- Kidney disease, 2021
- Lung condition (including COPD or emphysema), 2021
- Mental health condition (including depression or anxiety), 2021
- Stroke, 2021
- Any other long term health conditions, 2021
Children and young people (0 to 14 years), Aboriginal persons
- Asthma, 2021
- Mental health condition (including depression or anxiety), 2021
- Any other long term health conditions, 2021
Disability
- Unpaid assistance provided by Aboriginal people aged 15 years and over to persons with a disability, 2021
- Aboriginal persons with a profound or severe disability (includes people in long-term accommodation), 2021
- Aboriginal persons with a profound or severe disability and living in households, 2021
- Aboriginal persons aged 0 to 64 years and over with a profound or severe disability (includes people in long-term accommodation), 2021
- Aboriginal persons aged 0 to 64 years with a profound or severe disability and living in households, 2021
- Aboriginal persons aged 65 years and over with a profound or severe disability (includes people in long-term accommodation), 2021
- Aboriginal persons aged 65 years and over with a profound or severe disability and living in households, 2021
Admissions by sex (excluding same-day admissions for renal dialysis)
- Male, female, and total admissions, 2017/18 to 2019/20
Admissions by age (excluding same-day admissions for renal dialysis)
- Total admissions, Aboriginal persons aged 0 to 14, 15 to 24, 25 to 44, 45 to 64, and 65 years and over, 2017/18 to 2019/20
Admissions by selected principal diagnosis
- Infectious and parasitic diseases, Aboriginal persons, 2017/18 to 2019/20
- All cancers, Aboriginal persons, 2017/18 to 2019/20
- Endocrine, nutritional and metabolic diseases, Aboriginal persons, 2017/18 to 2019/20
- - Diabetes, Aboriginal persons, 2017/18 to 2019/20
- mental health-related conditions, Aboriginal persons, 2017/18 to 2019/20
- - Mood affective disorders, Aboriginal persons, 2017/18 to 2019/20
- Nervous system diseases, Aboriginal persons, 2017/18 to 2019/20
- Eye and adnexa diseases, Aboriginal persons, 2017/18 to 2019/20
- Ear and mastoid process diseases, Aboriginal persons, 2017/18 to 2019/20
- Circulatory system diseases, Aboriginal persons, 2017/18 to 2019/20
- - Ischaemic heart disease, Aboriginal persons, 2017/18 to 2019/20
- - Heart failure, Aboriginal persons, 2017/18 to 2019/20
- Respiratory system diseases, Aboriginal persons, 2017/18 to 2019/20
- - Asthma, Aboriginal persons, 2017/18 to 2019/20
- - Chronic obstructive pulmonary disease (COPD), Aboriginal persons, 2017/18 to 2019/20
- Digestive system diseases, Aboriginal persons, 2017/18 to 2019/20
- Skin and subcutaneous tissue diseases, Aboriginal persons, 2017/18 to 2019/20
- Musculoskeletal system and connective tissue diseases, Aboriginal persons, 2017/18 to 2019/20
- Genitourinary system diseases, Aboriginal persons, 2017/18 to 2019/20
- - Chronic kidney disease, Aboriginal persons, 2017/18 to 2019/20
- Pregnancy, childbirth and the puerperium, Aboriginal females aged 15 to 44 years, 2017/18 to 2019/20
- Congenital malformations, deformations and chromosomal abnormalities, Aboriginal persons, 2017/18 to 2019/20
- Injury, poisoning and other external causes, Aboriginal persons, 2017/18 to 2019/20
Admissions by selected principal diagnosis and age
- Infectious and parasitic diseases, Aboriginal persons aged 0 to 14 years, and 15 years and over, 2017/18 to 2019/20
- Respiratory system diseases, Aboriginal persons aged 0 to 14 years, and 15 years and over, 2017/18 to 2019/20
- Digestive system diseases, Aboriginal persons aged 0 to 14 years, and 15 years and over, 2017/18 to 2019/20
- Skin and subcutaneous tissue diseases, Aboriginal persons aged 0 to 14 years, and 15 years and over, 2017/18 to 2019/20
- Injury, poisoning and other external causes, Aboriginal persons aged 0 to 14 years, and 15 years and over, 2017/18 to 2019/20
Admissions by principal diagnosis of injury or poisoning, by external cause
- Transport crash injury, Aboriginal persons, 2017/18 to 2019/20
- Falls, Aboriginal persons, 2017/18 to 2019/20
- Injury due to exposure to inanimate mechanical forces, Aboriginal persons, 2017/18 to 2019/20
- Injury due to exposure to animate mechanical forces, Aboriginal persons, 2017/18 to 2019/20
- Intentional self-harm, Aboriginal persons, 2017/18 to 2019/20
- Assault, Aboriginal persons, 2017/18 to 2019/20
- Total diagnosis of injury or poisoning, by external cause, Aboriginal persons, 2017/18 to 2019/20
Same-day admissions for renal dialysis
- Same-day admissions for dialysis for kidney disease, Aboriginal persons, 2017/18 to 2019/20
Potentially preventable hospitalisations
- Potentially preventable conditions, Aboriginal persons, 2017/18 to 2019/20
Potentially preventable hospitalisations by age
- Potentially preventable conditions, Aboriginal persons aged 0 to 14, 15 to 24, 25 to 44, 45 to 64, and 65 years and over, 2017/18 to 2019/20
Potentially preventable hospitalisations - Vaccine-preventable conditions
- Vaccine-preventable conditions - pneumonia and influenza, Aboriginal persons, 2017/18 to 2019/20
- Total Vaccine-preventable conditions, Aboriginal persons, 2017/18 to 2019/20
Potentially preventable hospitalisations - Acute conditions
- Acute cellulitis, Aboriginal persons, 2017/18 to 2019/20
- Acute convulsions and epilepsy, Aboriginal persons, 2017/18 to 2019/20
- Acute dental conditions, Aboriginal persons, 2017/18 to 2019/20
- Acute ear, nose and throat infections, Aboriginal persons, 2017/18 to 2019/20
- Acute urinary tract infections, including pyelonephritis, Aboriginal persons, 2017/18 to 2019/20
- Total acute conditions, Aboriginal persons, 2017/18 to 2019/20
Potentially preventable hospitalisations - Chronic conditions
- Chronic angina, Aboriginal persons, 2017/18 to 2019/20
- Chronic asthma, Aboriginal persons, 2017/18 to 2019/20
- Chronic congestive cardiac failure, Aboriginal persons, 2017/18 to 2019/20
- Chronic obstructive pulmonary disease (COPD), Aboriginal persons, 2017/18 to 2019/20
- Chronic diabetes complications, Aboriginal persons, 2017/18 to 2019/20
- Chronic iron deficiency anaemia, Aboriginal persons, 2017/18 to 2019/20
- Total chronic conditions, Aboriginal persons, 2017/18 to 2019/20
Emergency department presentations, total - by triage category
- Total presentations, Aboriginal persons, 2019/20
- Resuscitation and emergency presentations - Total, Aboriginal persons, 2019/20
- Urgent presentations - Total, Aboriginal persons, 2019/20
- Semi-urgent presentations - Total, Aboriginal persons, 2019/20
- Non-urgent presentations - Total, Aboriginal persons, 2019/20
Emergency department presentations, total - by principal diagnosis
- Total presentations, Aboriginal persons, 2019/20
- Total presentations for certain infectious and parasitic diseases, Aboriginal persons, 2019/20
- Total presentations for mental and behavioural disorders, Aboriginal persons, 2019/20
- Total presentations for diseases of the circulatory system, Aboriginal persons, 2019/20
- Total presentations for diseases of the respiratory system, Aboriginal persons, 2019/20
- Total presentations for diseases of the digestive system, Aboriginal persons, 2019/20
- Total presentations for diseases of the musculoskeletal system and connective tissue, Aboriginal persons, 2019/20
- Total presentations for diseases of the genitourinary system, 2019/20
- Total presentations for injury, poisoning and certain other consequences of external causes, Aboriginal persons, 2019/20
- Total presentations for factors influencing health status and contact with health services, Aboriginal persons, 2019/20
Emergency department presentations, resuscitation and emergency - by principal diagnosis
- Resuscitation and emergency presentations - Total, Aboriginal persons, 2019/20
- Resuscitation and emergency presentations for diseases of the respiratory system, Aboriginal persons, 2019/20
- Resuscitation and emergency presentations for injury, poisoning and certain other consequences of external causes, Aboriginal persons, 2019/20
Emergency department presentations, urgent - by principal diagnosis
- Urgent presentations - Total, Aboriginal persons, 2019/20
- Urgent presentations for diseases of the respiratory system, Aboriginal persons, 2019/20
- Urgent presentations for injury, poisoning and certain other consequences of external causes, Aboriginal persons, 2019/20
Emergency department presentations, resuscitation, emergency and urgent - by principal diagnosis
- Resuscitation, emergency and urgent presentations - Total, Aboriginal persons, 2019/20
- Resuscitation, emergency and urgent presentations for certain infectious and parasitic diseases, Aboriginal persons, 2019/20
- Resuscitation, emergency and urgent presentations for mental and behavioural disorders, Aboriginal persons, 2019/20
- Resuscitation, emergency and urgent presentations for diseases of the respiratory system, Aboriginal persons, 2019/20
- Resuscitation, emergency and urgent presentations for diseases of the digestive system, Aboriginal persons, 2019/20
- Resuscitation, emergency and urgent presentations for diseases of the musculoskeletal system and connective tissue, Aboriginal persons, 2019/20
- Resuscitation, emergency and urgent presentations for diseases of the genitourinary system, Aboriginal persons, 2019/20
- Resuscitation, emergency and urgent presentations for factors influencing health status and contact with health services, Aboriginal persons, 2019/20
Emergency department presentations, semi-urgent - by principal diagnosis
- Semi-urgent presentations - Total, Aboriginal persons, 2019/20
- Semi-urgent presentations for injury, poisoning and certain other consequences of external causes, Aboriginal persons, 2019/20
- Semi-urgent presentations for factors influencing health status and contact with health services, Aboriginal persons, 2019/20
Emergency department presentations, non-urgent - by principal diagnosis
- Non-urgent presentations - Total, Aboriginal persons, 2019/20
- Non-urgent presentations for injury, poisoning and certain other consequences of external causes, Aboriginal persons, 2019/20
- Non-urgent presentations for factors influencing health status and contact with health services, Aboriginal persons, 2019/20
Emergency department presentations, semi-urgent and non-urgent - by principal diagnosis
- Semi-urgent and non-urgent presentations - Total, Aboriginal persons, 2019/20
- Semi-urgent and non-urgent presentations for certain infectious and parasitic diseases, Aboriginal persons, 2019/20
- Semi-urgent and non-urgent presentations for mental and behavioural disorders, Aboriginal persons, 2019/20
- Semi-urgent and non-urgent presentations for diseases of the respiratory system, Aboriginal persons, 2019/20
- Semi-urgent and non-urgent presentations for diseases of the digestive system, Aboriginal persons, 2019/20
- Semi-urgent and non-urgent presentations for diseases of the musculoskeletal system and connective tissue, Aboriginal persons, 2019/20
- Semi-urgent and non-urgent presentations for diseases of the genitourinary system, 2019/20
Fact sheets
Data release: Fact sheets - Age-related rates of Emergency Department presentation
The emergency department (ED) plays a pivotal role in providing the public with access to acute health care and the provision of support to primary health care. There has been an increasing demand on these services with the major drivers being the age at which patients present, the patient’s clinical urgency and whether or not these patients are admitted to hospital. This fact sheet investigates these drivers in relation to ED presentations.
Click here to access the fact sheet.
2022
Data release: 15 December 2022
Data release: By Population Health Area, Local Government Area, Primary Health Network, quintile of socioeconomic disadvantage of area (including within Primary Health Network) and Remoteness Area
Social Health Atlases of Australia
Emergency department presentations, by age and sex
- Male presentations, by broad age group, 2019/20
- Female presentations, by broad age group, 2019/20
- Total presentations, by broad age group, 2019/20
Emergency department presentations, by triage category
- Resuscitation presentations, 2019/20
- Emergency presentations, 2019/20
- Urgent presentations, 2019/20
- Semi-urgent presentations, 2019/20
- Non-urgent presentations, 2019/20
- Total presentations, 2019/20
Emergency department presentations, by principal diagnosis
- Total presentations for certain infectious and parasitic diseases, 2019/20
- Total presentations for mental and behavioural disorders, 2019/20
- Total presentations for diseases of the circulatory system, 2019/20
- Total presentations for diseases of the respiratory system, 2019/20
- Total presentations for diseases of the digestive system, 2019/20
- Total presentations for diseases of the musculoskeletal system and connective tissue, 2019/20
- Total presentations for diseases of the genitourinary system, 2019/20
- Total presentations for injury, poisoning and certain other consequences of external causes, 2019/20
- Total presentations for factors influencing health status and contact with health services, 2019/20
Emergency department presentations for certain infectious and parasitic diseases, by age and sex
- Male presentations, by broad age group, 2019/20
- Female presentations, by broad age group, 2019/20
- Total presentations, by broad age group, 2019/20
Emergency department presentations for mental and behavioural disorders, by age and sex
- Male presentations, by broad age group, 2019/20
- Female presentations, by broad age group, 2019/20
- Total presentations, by broad age group, 2019/20
Emergency department presentations for diseases of the circulatory system, by age and sex
- Male presentations, by broad age group, 2019/20
- Female presentations, by broad age group, 2019/20
- Total presentations, by broad age group, 2019/20
Emergency department presentations for diseases of the respiratory system, by age and sex
- Male presentations, by broad age group, 2019/20
- Female presentations, by broad age group, 2019/20
- Total presentations, by broad age group, 2019/20
Emergency department presentations for diseases of the digestive system, by age
- Total presentations, by broad age group, 2019/20
Emergency department presentations for diseases of the musculoskeletal system and connective tissue, by age
- Total presentations, by broad age group, 2019/20
Emergency department presentations for diseases of the genitourinary system, by age and sex
- Male presentations, by broad age group, 2019/20
- Female presentations, by broad age group, 2019/20
- Total presentations, by broad age group, 2019/20
Emergency department presentations for injury, poisoning and certain other consequences of external causes, by age and sex
- Male presentations, by broad age group, 2019/20
- Female presentations, by broad age group, 2019/20
- Total presentations, by broad age group, 2019/20
Emergency department presentations for factors influencing health status and contact with health services, by age
- Total presentations, by broad age group, 2019/20
Click hereto access the maps for these atlases.
Click hereto access the graphs for these atlases.
Click hereto access the data for these atlases.
Data release: By quintile of socioeconomic disadvantage of area and Remoteness Area time series
Social Health Atlases of Australia
Emergency department presentations - Total
- Emergency department presentations, 2019/20
Click hereto access the graphs for these atlases.
Click hereto access the data for these atlases.
Data release: 24 November 2022
Data release: By Population Health Area, Local Government Area, Primary Health Network, quintile of socioeconomic disadvantage of area (including within Primary Health Network) and Remoteness Area
Social Health Atlases of Australia
Age distribution - 5 year age groups
- Males, females, persons: 5-year age groups, estimated resident population (ERP), 2021
Birthplace & non-English-speaking residents
- Australian-born population, 2021
- Born overseas - in predominantly English-speaking countries, 2021
- Born overseas - in predominantly non-English-speaking (NES) countries, 2021
- Resident in Australia for five years or more and born in NES countries, 2021
- Resident in Australia for less than five years and born in NES countries, 2021
- Poor proficiency in English and born overseas, 2021
Non-English-speaking countries of birth
- Top ten non-English-speaking countries of origin, 2021
Education
- Preschool enrolments, children aged 4 years old, 5 years old, 4 and 5 years old, 2021
- Preschool attendance, children aged 4 years old, 5 years old, 4 and 5 years old, 2021
- Early school leavers, 2021
- Full-time participation in secondary school education at age 16, 2021
- School leavers enrolled in higher education (including Vic), 2021
Learning or Earning
- Learning or Earning at ages 15 to 24, 2021
Families
- Single parent families with children aged less than 15 years, 2021
- Jobless families with children aged less than 15 years, 2021
- Children aged less than 15 years in jobless families, 2021
- Children in families where the mother has low educational attainment, 2021
Child care: unpaid
- Child care to own child/children (unpaid), 2021
- Child care to other child/children (unpaid), 2021
- Total (unpaid) child care, 2021
Volunteering
- Voluntary work for an organisation or group, 2021
Housing, rent assistance and vehicle access
- Persons living in crowded dwellings, 2021
- Persons living in severely crowded dwellings, 2021
- Aboriginal persons living in crowded dwellings, 2021
- Aboriginal persons living in severely crowded dwellings, 2021
- Housing suitability, 2021
- Social housing (rented dwellings), 2021
- Privately rented dwellings, 2021
- Social housing (persons in rented dwellings), 2021
- Privately rented dwellings (persons), 2021
- No motor vehicle, 2021
Labour force
- Unemployment, June 2021
- Labour force participation, June 2021
- Female labour force participation, 2021
Long-term health conditions - All ages
- One/ Two/ Three long-term health conditions, 2021 URP
- One or more long-term health conditions, 2021 URP
Long-term health conditions - Adults (15 years and over)
- One/ Two/ Three long-term health conditions, 2021 URP
- One or more long-term health conditions, 2021 URP
Long-term health conditions - Children and young people (0 to 14 years)
- One/ Two long-term health conditions, 2021 URP
- One or more long-term health conditions, 2021 URP
Long-term health conditions, by selected condition - All ages
- Arthritis, 2021 URP
- Asthma, 2021 URP
- Cancer (including remission), 2021 URP
- Dementia (including Alzheimer's), 2021 URP
- Diabetes (excluding gestational diabetes), 2021 URP
- Heart disease (including heart attack or angina), 2021 URP
- Kidney disease, 2021 URP
- Lung condition (including COPD or emphysema), 2021 URP
- Mental health condition (including depression or anxiety), 2021 URP
- Stroke, 2021 URP
- Any other long term health conditions, 2021 URP
Long-term health conditions, by selected condition - Adults (15 years and over)
- Arthritis, 2021 URP
- Asthma, 2021 URP
- Cancer (including remission), 2021 URP
- Dementia (including Alzheimer's), 2021 URP
- Diabetes (excluding gestational diabetes), 2021 URP
- Heart disease (including heart attack or angina), 2021 URP
- Kidney disease, 2021 URP
- Lung condition (including COPD or emphysema), 2021 URP
- Mental health condition (including depression or anxiety), 2021 URP
- Stroke, 2021 URP
- Any other long term health conditions, 2021 URP
Long-term health conditions, by selected condition - Children and young people (0 to 14 years)
- Asthma, 2021 URP
- Mental health condition (including depression or anxiety), 2021 URP
- Any other long term health conditions, 2021 URP
Disability (ABS Census)
- Assistance to people with a disability (unpaid), 2021
- Profound or severe disability (includes people in long-term accommodation), All ages, 2021
- Profound or severe disability and living in households, All ages, 2021
- Profound or severe disability (includes people in long-term accommodation), 0 to 64 years, 2021
- Profound or severe disability and living in households, 0 to 64 years, 2021
- Profound or severe disability (includes people in long-term accommodation), 65 years and over, 2021
- Profound or severe disability and living in households, 65 years and over, 2021
Profound or severe core activity limitation (modelled estimates)
- Profound or severe core activity limitation and living in households, males by age, 2018
- Profound or severe core activity limitation and living in households, females by age, 2018
- Profound or severe core activity limitation and living in households, persons by age, 2018
Moderate or mild core activity limitation (modelled estimates)
- Moderate or mild core activity limitation and living in households, males by age, 2018
- Moderate or mild core activity limitation and living in households, females by age, 2018
- Moderate or mild core activity limitation and living in households, persons by age, 2018
Primary carers (modelled estimates)
- Primary carers, males by age, 2018
- Primary carers, females by age, 2018
- Primary carers, persons by age, 2018
Disability (NDIS)
- National Disability Insurance Scheme participants, June 2022
Commonwealth Home Support Programme
- Clients living alone, 2020/21
- Clients with carer, 2020/21
- Indigenous clients (per total clients), 2020/21
- Indigenous clients (per Indigenous population), 2020/21
- Non-English-speaking clients, 2020/21
- Total clients, 2020/21
- Allied health therapy clients, 2020/21
- Domestic assistance clients, 2020/21
- Flexible respite clients, 2020/21
- Goods and equipment clients, 2020/21
- Home maintenance clients, 2020/21
- Home modification clients, 2020/21
- Meals clients, 2020/21
- Nursing clients, 2020/21
- Personal care clients, 2020/21
- Social support (group) clients, 2020/21
- Social support (individual) clients, 2020/21
- Specialised support services clients, 2020/21
- Transport clients, 2020/21
Admissions by hospital type and sex (excluding same-day admissions for renal dialysis)
- Male total admissions - Public/ All hospitals, 2019/20
- Female total admissions - Public/ All hospitals, 2019/20
- Total admissions - Public, Private, All hospitals, 2019/20
Hospital admissions by principal diagnosis and sex
- Admissions for infectious and parasitic diseases, males/ females/ persons - Public hospitals, 2019/20
- Admissions for all cancers, males/ females/ persons - Public hospitals, 2019/20
- Admissions for endocrine, nutritional and metabolic diseases, males/ females/ persons - Public hospitals, 2019/20
- Admissions for diabetes, males/ females/ persons - Public hospitals, 2019/20
- Admissions for mental health-related conditions, males/ females/ persons - Public hospitals, 2019/20
- Admissions for mood affective disorders, males/ females/ persons - Public hospitals, 2019/20
- Admissions for nervous system diseases, males/ females/ persons - Public hospitals, 2019/20
- Admissions for eye and adnexa diseases, males/ females/ persons - Public hospitals, 2019/20
- Admissions for ear and mastoid process diseases, males/ females/ persons - Public hospitals, 2019/20
- Admissions for circulatory diseases, males/ females/ persons - Public hospitals, 2019/20
- Admissions for ischaemic heart disease, males/ females/ persons - Public hospitals, 2019/20
- Admissions for heart failure, males/ females/ persons - Public hospitals, 2019/20
- Admissions for stroke, males/ females/ persons - Public hospitals, 2019/20
- Admissions for respiratory diseases, males/ females/ persons - Public hospitals, 2019/20
- Admissions for asthma, males/ females/ persons - Public hospitals, 2019/20
- Admissions for chronic obstructive pulmonary disease (COPD), males/ females/ persons - Public hospitals, 2019/20
- Admissions for digestive system diseases, males/ females/ persons - Public hospitals, 2019/20
- Admissions for skin and subcutaneous tissue diseases, males/ females/ persons - Public hospitals, 2019/20
- Admissions for musculoskeletal system and connective tissue diseases, males/ females/ persons - Public hospitals, 2019/20
- Admissions for genitourinary system diseases, males/ females/ persons - Public hospitals, 2019/20
- Admissions for chronic kidney disease, males/ females/ persons - Public hospitals, 2019/20
- Admissions for certain conditions originating in the perinatal period, persons - Public hospitals, 2019/20
- Admissions for congenital malformations, deformations and chromosomal abnormalities, males/ females/ persons - Public hospitals, 2019/20
- Admissions for pregnancy, childbirth and the puerperium, females - Public hospitals, 2019/20
- Admissions for injury and poisoning, males/ females/ persons - Public hospitals, 2019/20
Admissions by principal diagnosis of injury or poisoning by external cause and sex
- Transport crash injury, males/ females/ persons - Public hospitals, 2019/20
- Falls, males/ females/ persons - Public hospitals, 2019/20
- Injury due to exposure to inanimate mechanical forces, males/ females/ persons - Public hospitals, 2019/20
- Injury due to exposure to animate mechanical forces, males/ females/ persons - Public hospitals, 2019/20
- Intentional self-harm, males/ females/ persons - Public hospitals, 2019/20
- Assault, males/ females/ persons - Public hospitals, 2019/20
- All diagnosis of injury or poisoning, by external cause, males/ females/ persons - Public hospitals, 2019/20
Hospital admissions by procedure
- Admissions for a tonsillectomy - Public/ Private/ All hospitals, 2019/20
- Admissions for a myringotomy, 0-9 years - Public/ Private/ All hospitals, 2019/20
- Admissions for a hysterectomy, females aged 30 to 59 years - Public/ Private/ All hospitals, 2019/20
- Admissions for a Caesarean section, females aged 15 to 44 years - Public/ Private/ All hospitals, 2019/20
- Admissions for a coronary artery bypass graft - Public/ Private/ All hospitals, 2019/20
- Admissions for a coronary angioplasty - Public/ Private/ All hospitals, 2019/20
- Admissions for a hip fracture - Public/ Private/ All hospitals, 2019/20
- Admissions for fibre optic colonoscopy - Public/ Private/ All hospitals, 2019/20
- Admissions for fibre optic colonoscopy excision - Public/ Private/ All hospitals, 2019/20
Same-day admissions for renal dialysis
- Admissions for same-day dialysis for kidney disease - Public hospitals, 2019/20
Potentially preventable hospitalisations - All conditions by broad age group
- Admissions for all potentially preventable conditions - Public hospitals, 2019/20
Potentially preventable hospitalisations - Vaccine-preventable conditions
- Admissions for vaccine-preventable conditions - pneumonia and influenza - Public hospitals, 2019/20
- Admissions for total vaccine-preventable conditions - Public hospitals, 2019/20
Potentially preventable hospitalisations - Acute conditions
- Admissions for acute cellulitis - Public hospitals, 2019/20
- Admissions for acute convulsions and epilepsy - Public hospitals, 2019/20
- Admissions for acute dental conditions - Public hospitals, 2019/20
- Admissions for acute ear, nose and throat infections - Public hospitals, 2019/20
- Admissions for acute gangrene - Public hospitals, 2019/20
- Admissions for acute urinary tract infections, including pyelonephritis - Public hospitals, 2019/20
- Admissions for total acute conditions - Public hospitals, 2019/20
Potentially preventable hospitalisations - Chronic conditions
- Admissions for chronic angina - Public hospitals, 2019/20
- Admissions for chronic asthma - Public hospitals, 2019/20
- Admissions for chronic congestive cardiac failure - Public hospitals, 2019/20
- Admissions for chronic obstructive pulmonary disease (COPD) - Public hospitals, 2019/20
- Admissions for chronic diabetes complications - Public hospitals, 2019/20
- Admissions for chronic hypertension - Public hospitals, 2019/20
- Admissions for chronic iron deficiency anaemia - Public hospitals, 2019/20
- Admissions for total chronic conditions - Public hospitals, 2019/20
Click hereto access the graphs for these atlases.
Click hereto access the data for these atlases.
Data release: By quintile of socioeconomic disadvantage of area and Remoteness Area time series
Social Health Atlases of Australia
Birthplace & non-English-speaking residents
- Australian-born population, 2021
- Born overseas - in predominantly English-speaking countries, 2021
- Born overseas - in predominantly non-English-speaking (NES) countries, 2021
- Resident in Australia for five years or more and born in NES countries, 2021
- Resident in Australia for less than five years and born in NES countries, 2021
- Poor proficiency in English and born overseas, 2021
Non-English-speaking countries of birth
- Top ten non-English-speaking countries of origin, 2021
Education
- Early school leavers, 2021
- Full-time participation in secondary school education at age 16, 2021
- School leavers enrolled in higher education (including Vic), 2021
Learning or Earning
- Learning or Earning at ages 15 to 24, 2021
Families
- Single parent families with children aged less than 15 years, 2021
- Jobless families with children aged less than 15 years, 2021
- Children aged less than 15 years in jobless families, 2021
- Children in families where the mother has low educational attainment, 2021
Child care: unpaid
- Child care to own child/children (unpaid), 2021
- Child care to other child/children (unpaid), 2021
- Total (unpaid) child care, 2021
Volunteering
- Voluntary work for an organisation or group, 2021
Housing, rent assistance and vehicle access
- Persons living in crowded dwellings, 2021
- Persons living in severely crowded dwellings, 2021
- Aboriginal persons living in crowded dwellings, 2021
- Aboriginal persons living in severely crowded dwellings, 2021
- Housing suitability, 2021
- Social housing (rented dwellings), 2021
- Privately rented dwellings, 2021
- Social housing (persons in rented dwellings), 2021
- Privately rented dwellings (persons), 2021
- No motor vehicle, 2021
Labour force
- Unemployment, June 2021
- Labour force participation, June 2021
- Female labour force participation, 2021
Disability (ABS Census)
- Assistance to people with a disability (unpaid), 2021
- Profound or severe disability (includes people in long-term accommodation), All ages, 2021
- Profound or severe disability and living in households, All ages, 2021
- Profound or severe disability (includes people in long-term accommodation), 0 to 64 years, 2021
- Profound or severe disability and living in households, 0 to 64 years, 2021
- Profound or severe disability (includes people in long-term accommodation), 65 years and over, 2021
- Profound or severe disability and living in households, 65 years and over, 2021
Admissions by hospital type and sex (excluding same-day admissions for renal dialysis)
- Male total admissions - Public/ All hospitals, 2019/20
- Female total admissions - Public/ All hospitals, 2019/20
- Total admissions - Public, Private, All hospitals, 2019/20
Hospital admissions by principal diagnosis and sex
- Admissions for infectious and parasitic diseases, males/ females/ persons - Public hospitals, 2019/20
- Admissions for all cancers, males/ females/ persons - Public hospitals, 2019/20
- Admissions for endocrine, nutritional and metabolic diseases, males/ females/ persons - Public hospitals, 2019/20
- Admissions for diabetes, males/ females/ persons - Public hospitals, 2019/20
- Admissions for mental health-related conditions, males/ females/ persons - Public hospitals, 2019/20
- Admissions for mood affective disorders, males/ females/ persons - Public hospitals, 2019/20
- Admissions for nervous system diseases, males/ females/ persons - Public hospitals, 2019/20
- Admissions for eye and adnexa diseases, males/ females/ persons - Public hospitals, 2019/20
- Admissions for ear and mastoid process diseases, males/ females/ persons - Public hospitals, 2019/20
- Admissions for circulatory diseases, males/ females/ persons - Public hospitals, 2019/20
- Admissions for ischaemic heart disease, males/ females/ persons - Public hospitals, 2019/20
- Admissions for heart failure, males/ females/ persons - Public hospitals, 2019/20
- Admissions for stroke, males/ females/ persons - Public hospitals, 2019/20
- Admissions for respiratory diseases, males/ females/ persons - Public hospitals, 2019/20
- Admissions for asthma, males/ females/ persons - Public hospitals, 2019/20
- Admissions for chronic obstructive pulmonary disease (COPD), males/ females/ persons - Public hospitals, 2019/20
- Admissions for digestive system diseases, males/ females/ persons - Public hospitals, 2019/20
- Admissions for skin and subcutaneous tissue diseases, males/ females/ persons - Public hospitals, 2019/20
- Admissions for musculoskeletal system and connective tissue diseases, males/ females/ persons - Public hospitals, 2019/20
- Admissions for genitourinary system diseases, males/ females/ persons - Public hospitals, 2019/20
- Admissions for chronic kidney disease, males/ females/ persons - Public hospitals, 2019/20
- Admissions for certain conditions originating in the perinatal period, persons - Public hospitals, 2019/20
- Admissions for congenital malformations, deformations and chromosomal abnormalities, males/ females/ persons - Public hospitals, 2019/20
- Admissions for pregnancy, childbirth and the puerperium, females - Public hospitals, 2019/20
- Admissions for injury and poisoning, males/ females/ persons - Public hospitals, 2019/20
Admissions by principal diagnosis of injury or poisoning by external cause and sex
- Transport crash injury, males/ females/ persons - Public hospitals, 2019/20
- Falls, males/ females/ persons - Public hospitals, 2019/20
- Injury due to exposure to inanimate mechanical forces, males/ females/ persons - Public hospitals, 2019/20
- Injury due to exposure to animate mechanical forces, males/ females/ persons - Public hospitals, 2019/20
- Intentional self-harm, males/ females/ persons - Public hospitals, 2019/20
- Assault, males/ females/ persons - Public hospitals, 2019/20
- All diagnosis of injury or poisoning, by external cause, males/ females/ persons - Public hospitals, 2019/20
Hospital admissions by procedure
- Admissions for a tonsillectomy - Public/ Private/ All hospitals, 2019/20
- Admissions for a myringotomy, 0-9 years - Public/ Private/ All hospitals, 2019/20
- Admissions for a hysterectomy, females aged 30 to 59 years - Public/ Private/ All hospitals, 2019/20
- Admissions for a Caesarean section, females aged 15 to 44 years - Public/ Private/ All hospitals, 2019/20
- Admissions for a coronary artery bypass graft - Public/ Private/ All hospitals, 2019/20
- Admissions for a coronary angioplasty - Public/ Private/ All hospitals, 2019/20
- Admissions for a hip fracture - Public/ Private/ All hospitals, 2019/20
- Admissions for fibre optic colonoscopy - Public/ Private/ All hospitals, 2019/20
- Admissions for fibre optic colonoscopy excision - Public/ Private/ All hospitals, 2019/20
Same-day admissions for renal dialysis
- Admissions for same-day dialysis for kidney disease - Public hospitals, 2019/20
Potentially preventable hospitalisations - All conditions by broad age group
- Admissions for all potentially preventable conditions - Public hospitals, 2019/20
Potentially preventable hospitalisations - Vaccine-preventable conditions
- Admissions for vaccine-preventable conditions - pneumonia and influenza - Public hospitals, 2019/20
- Admissions for total vaccine-preventable conditions - Public hospitals, 2019/20
Potentially preventable hospitalisations - Acute conditions
- Admissions for acute cellulitis - Public hospitals, 2019/20
- Admissions for acute convulsions and epilepsy - Public hospitals, 2019/20
- Admissions for acute dental conditions - Public hospitals, 2019/20
- Admissions for acute ear, nose and throat infections - Public hospitals, 2019/20
- Admissions for acute gangrene - Public hospitals, 2019/20
- Admissions for acute urinary tract infections, including pyelonephritis - Public hospitals, 2019/20
- Admissions for total acute conditions - Public hospitals, 2019/20
Potentially preventable hospitalisations - Chronic conditions
- Admissions for chronic angina - Public hospitals, 2019/20
- Admissions for chronic asthma - Public hospitals, 2019/20
- Admissions for chronic congestive cardiac failure - Public hospitals, 2019/20
- Admissions for chronic obstructive pulmonary disease (COPD) - Public hospitals, 2019/20
- Admissions for chronic diabetes complications - Public hospitals, 2019/20
- Admissions for chronic hypertension - Public hospitals, 2019/20
- Admissions for chronic iron deficiency anaemia - Public hospitals, 2019/20
- Admissions for total chronic conditions - Public hospitals, 2019/20
Click hereto access the graphs for these atlases.
Click hereto access the data for these atlases.
Fact sheet release: 31 October 2022
Emergency Department presentations for mental health-related conditions: variations by age group and socioeconomic disadvantage - UPDATE 2022
This Fact Sheet updates the version published in October 2021 (Emergency department presentations for mental health-related conditions: variations by age group and socioeconomic disadvantage) located here. As in that report, as data for South Australia were available for the latest financial year (in this case 2021/22), they have been included as they may provide an insight into recent national trends.
Click here to access the Fact Sheet.
Data release: 4 August 2022
Atlases
2021 Census data release - Aboriginal and Torres Strait Islander Population
Data release: By Indigenous Area, Primary Health Network, quintile of socioeconomic disadvantage of area and Remoteness Area
Social Health Atlases of Australia
The topics and indicators in this latest release are listed below. Click the matrix table below to view the data and the format by which they are published.
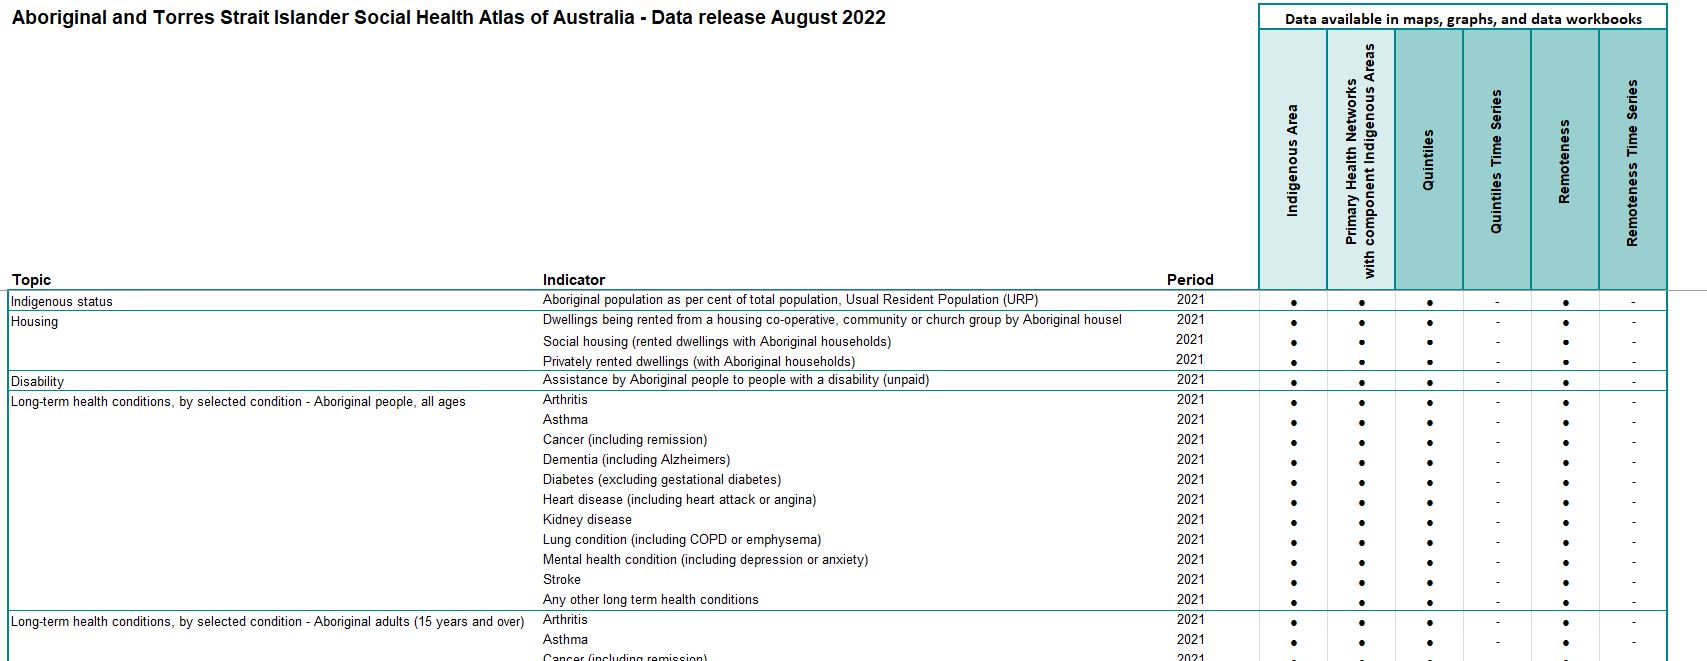
Indigenous status
- Aboriginal population as per cent of total population, 2021 Usual Resident Population (URP)
Housing
- Dwellings being rented from a housing co-operative, community or church group by Aboriginal households, 2021 URP
- Social housing (rented dwellings with Aboriginal households), 2021 URP
- Privately rented dwellings (with Aboriginal households), 2021 URP
Disability
- Assistance by Aboriginal people to people with a disability (unpaid), 2021 URP
Long-term health conditions, by selected condition - Aboriginal people, all ages
- Arthritis, 2021 URP
- Asthma, 2021 URP
- Cancer (including remission), 2021 URP
- Dementia (including Alzheimer's), 2021 URP
- Diabetes (excluding gestational diabetes), 2021 URP
- Heart disease (including heart attack or angina), 2021 URP
- Kidney disease, 2021 URP
- Lung condition (including COPD or emphysema), 2021 URP
- Mental health condition (including depression or anxiety), 2021 URP
- Stroke, 2021 URP
- Any other long term health conditions, 2021 URP
Long-term health conditions, by selected condition - Aboriginal adults (15 years and over)
- Arthritis, 2021 URP
- Asthma, 2021 URP
- Cancer (including remission), 2021 URP
- Dementia (including Alzheimer's), 2021 URP
- Diabetes (excluding gestational diabetes), 2021 URP
- Heart disease (including heart attack or angina), 2021 URP
- Kidney disease, 2021 URP
- Lung condition (including COPD or emphysema), 2021 URP
- Mental health condition (including depression or anxiety), 2021 URP
- Stroke, 2021 URP
- Any other long term health conditions, 2021 URP
Long-term health conditions, by selected condition - Aboriginal children and young people (0 to 14 years)
- Asthma, 2021 URP
- Mental health condition (including depression or anxiety), 2021 URP
- Any other long term health conditions, 2021 URP
Click hereto access the maps for these atlases.
Click hereto access the data for these atlases.
Data release: Indigenous Status Comparison
Indigenous Status Comparison: Social Health Atlases of Australia
The topics and indicators in this latest release are listed below. Click the matrix table below to view the data and the format by which they are published.
Indigenous status
- Indigenous/ Non-Indigenous population as per cent of total population, 2021 Usual Resident Population (URP)
Housing
- Dwellings being rented from a housing co-operative, community or church group by Indigenous/ Non-Indigenous households, 2021 URP
- Social housing (rented dwellings with Indigenous/ Non-Indigenous households), 2021 URP
- Privately rented dwellings (with Indigenous/ Non-Indigenous households), 2021 URP
Long-term health conditions, by selected condition - Indigenous/ Non-Indigenous people, all ages
- Arthritis, 2021 URP
- Asthma, 2021 URP
- Cancer (including remission), 2021 URP
- Dementia (including Alzheimer's), 2021 URP
- Diabetes (excluding gestational diabetes), 2021 URP
- Heart disease (including heart attack or angina), 2021 URP
- Kidney disease, 2021 URP
- Lung condition (including COPD or emphysema), 2021 URP
- Mental health condition (including depression or anxiety), 2021 URP
- Stroke, 2021 URP
- Any other long term health conditions, 2021 URP
Fact sheets
Data release: Fact sheets - Deaths from COVID-19: largely an eastern states and older person phenomenon
This Fact sheet describes the demographic and socioeconomic profile of people who have died from COVID, using preliminary data supplied by the Australian Bureau of Statistics for deaths due to COVID-19 registered in Australia over the period from March 2020 to May 2022. It reveals details of variations in deaths by wave of the pandemic, by state and, for the overseas born, by country of birth.
Click here to access the fact sheet.
Data release: 11 July 2022
Census data release
Data release: By Population Health Area, Statistical Areas Level 2, Local Government Area, Primary Health Network, quintile of socioeconomic disadvantage of area and Remoteness Area
Social Health Atlases of Australia
The topics and indicators in this latest release are listed below. Click the matrix table below to view the data and the format by which they are published.
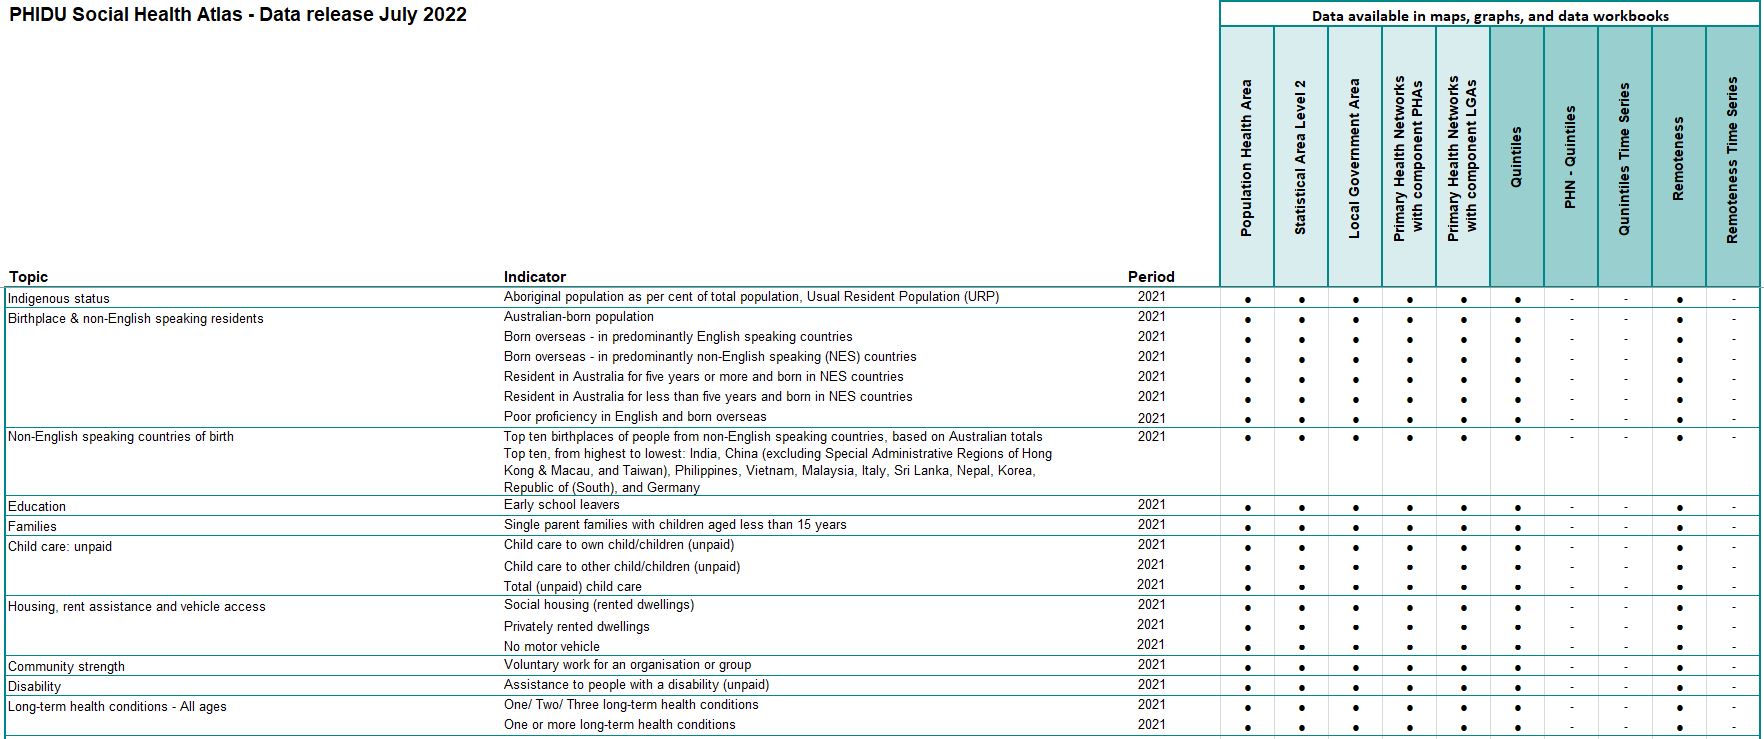
Indigenous status
- Aboriginal population as per cent of total population, 2021 Usual Resident Population (URP)
Birthplace & non-English-speaking residents
- Australian-born population, 2021 URP
- Born overseas - in predominantly English-speaking countries, 2021 URP
- Born overseas - in predominantly non-English-speaking (NES) countries, 2021 URP
- Resident in Australia for five years or more and born in NES countries, 2021 URP
- Resident in Australia for less than five years and born in NES countries, 2021 URP
- Poor proficiency in English and born overseas, 2021 URP
Non-English-speaking countries of birth
- Top ten birthplaces of people from non-English-speaking countries, based on Australian totals, 2021 URP
Education
- Early school leavers, 2021 URP
Families
- Single parent families with children aged less than 15 years, 2021 URP
Child care: unpaid
- Child care to own child/children (unpaid), 2021 URP
- Child care to other child/children (unpaid), 2021 URP
- Total (unpaid) child care, 2021 URP
Housing, rent assistance and vehicle access
- Social housing (rented dwellings), 2021 URP
- Privately rented dwellings, 2021 URP
- No motor vehicle, 2021 URP
Community strength
- Voluntary work for an organisation or group, 2021 URP
Disability
- Assistance to people with a disability (unpaid), 2021 URP
Long-term health conditions - All ages
- One/ Two/ Three long-term health conditions, 2021 URP
- One or more long-term health conditions, 2021 URP
Long-term health conditions - Adults (15 years and over)
- One/ Two/ Three long-term health conditions, 2021 URP
- One or more long-term health conditions, 2021 URP
Long-term health conditions - Children and young people (0 to 14 years)
- One/ Two long-term health conditions, 2021 URP
- One or more long-term health conditions, 2021 URP
Long-term health conditions, by selected condition - All ages
- Arthritis, 2021 URP
- Asthma, 2021 URP
- Cancer (including remission), 2021 URP
- Dementia (including Alzheimer's), 2021 URP
- Diabetes (excluding gestational diabetes), 2021 URP
- Heart disease (including heart attack or angina), 2021 URP
- Kidney disease, 2021 URP
- Lung condition (including COPD or emphysema), 2021 URP
- Mental health condition (including depression or anxiety), 2021 URP
- Stroke, 2021 URP
- Any other long term health conditions, 2021 URP
Long-term health conditions, by selected condition - Adults (15 years and over)
- Arthritis, 2021 URP
- Asthma, 2021 URP
- Cancer (including remission), 2021 URP
- Dementia (including Alzheimer's), 2021 URP
- Diabetes (excluding gestational diabetes), 2021 URP
- Heart disease (including heart attack or angina), 2021 URP
- Kidney disease, 2021 URP
- Lung condition (including COPD or emphysema), 2021 URP
- Mental health condition (including depression or anxiety), 2021 URP
- Stroke, 2021 URP
- Any other long term health conditions, 2021 URP
Long-term health conditions, by selected condition - Children and young people (0 to 14 years)
- Asthma, 2021 URP
- Mental health condition (including depression or anxiety), 2021 URP
- Any other long term health conditions, 2021 URP
Click hereto access the maps for these atlases.
Click hereto access the data for these atlases.
Data release: 21 June 2022
Data release: Topic-Specific Atlases - Indigenous Status Comparison: Social Health Atlas of Australia
The Indigenous Status Comparison: Social Health Atlas of Australia, presents selected topics and compares indicators between Indigenous and Non-Indigenous populations in Australia. This is available by Indigenous Areas, including total for the Greater Capital City Statistical Areas/Rest of States/NT; and States/Territories.
Higher education
- Indigenous/ Non-Indigenous school leavers enrolled in higher education, students, 2021
Mothers and babies
- Low birthweight Indigenous/ Non-Indigenous babies, 2017 to 2019
- Indigenous/ Non-Indigenous women smoking during pregnancy, 2017 to 2019
- Indigenous/ Non-Indigenous antenatal visits, 2017 to 2019
Click here to access the maps for these atlases.
Click here to access the data for these atlases.
Data release: By Population Health Area, Local Government Area, Primary Health Network, quintile of socioeconomic disadvantage of area (including within Primary Health Network) and Remoteness Area
Social Health Atlases of Australia
The topics and indicators in this latest release are listed below. Click the matrix table below to view the data and the format by which they are published.
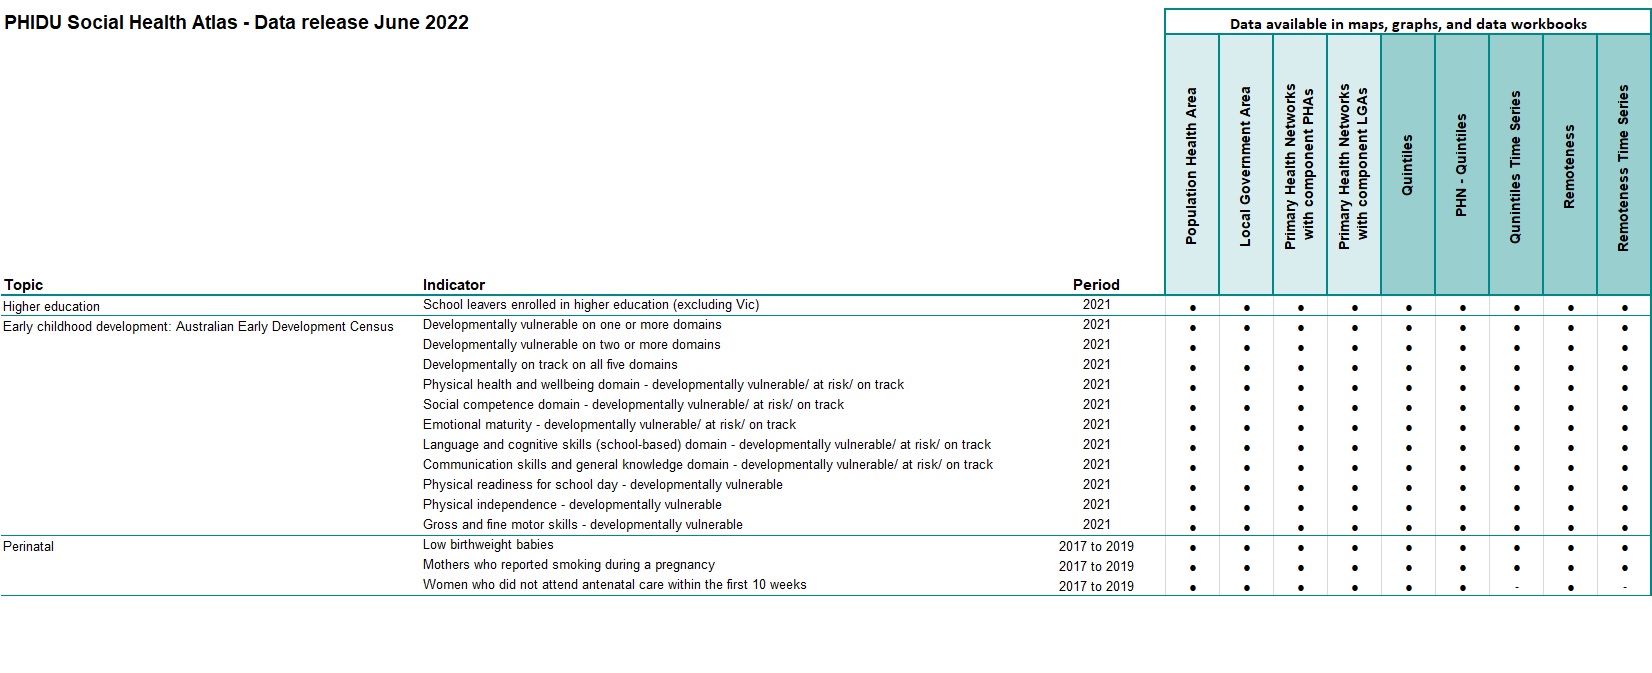
Higher education
- School leavers enrolled in higher education (excluding Vic), 2021
Early childhood development: Australian Early Development Census
- Developmentally vulnerable on one or more domains, 2021
- Developmentally vulnerable on two or more domains, 2021
- Developmentally on track on all five domains, 2021
- Physical health and wellbeing domain - developmentally vulnerable/ at risk/ on track, 2021
- Social competence domain - developmentally vulnerable/ at risk/ on track, 2021
- Emotional maturity - developmentally vulnerable/ at risk/ on track, 2021
- Language and cognitive skills (school-based) domain - developmentally vulnerable/ at risk/ on track, 2021
- Communication skills and general knowledge domain - developmentally vulnerable/ at risk/ on track, 2021
- Physical readiness for school day - developmentally vulnerable, 2021
- Physical independence - developmentally vulnerable, 2021
- Gross and fine motor skills - developmentally vulnerable, 2021
Perinatal
- Low birthweight babies, 2017 to 2019
- Mothers who reported smoking during a pregnancy, 2017 to 2019
- Women who did not attend antenatal care within the first 10 weeks, 2017 to 2019
Health workforce (Local Government Area and Remoteness Area only)
- General Medical Practitioners, 2020
- Specialist Practitioners (as reported excluding GPs), 2020
- Unknown/Not applicable Medical Practitioners, 2020
- Total Medical Practitioners, 2020
- Registered Nurses only, 2020
- Registered Nurses who are also Midwives, 2020
- Total Registered Nurses, 2020
- Enrolled Nurses, 2020
- Midwives (may also be a Registered Nurse or Enrolled Nurse), 2020
- Total Nurses (Registered Nurses, Enrolled Nurses or Midwives, each person only counted once), 2020
- Dentists, 2020
- Total Dental Practitioners (includes Dentists, Oral health therapists, Dental hygienists, Dental therapists and Dental prosthetists), 2020
Click hereto access the maps for these atlases.
Click hereto access the data for these atlases.
Data release: By quintile of socioeconomic disadvantage of area and Remoteness Area time series
Social Health Atlases of Australia
The topics and indicators in this latest release are listed below. Click the matrix table below to view the data and the format by which they are published.
Higher education
- School leavers enrolled in higher education (excluding Vic), 2021
Early childhood development: Australian Early Development Census
- Developmentally vulnerable on one or more domains, 2021
- Developmentally vulnerable on two or more domains, 2021
- Developmentally on track on all five domains, 2021
- Physical health and wellbeing domain - developmentally vulnerable/ at risk/ on track, 2021
- Social competence domain - developmentally vulnerable/ at risk/ on track, 2021
- Emotional maturity - developmentally vulnerable/ at risk/ on track, 2021
- Language and cognitive skills (school-based) domain - developmentally vulnerable/ at risk/ on track, 2021
- Communication skills and general knowledge domain - developmentally vulnerable/ at risk/ on track, 2021
- Physical readiness for school day - developmentally vulnerable, 2021
- Physical independence - developmentally vulnerable, 2021
- Gross and fine motor skills - developmentally vulnerable, 2021
Perinatal
- Low birthweight babies, 2017 to 2019
- Mothers who reported smoking during a pregnancy, 2017 to 2019
Click hereto access the graphs for these atlases.
Click hereto access the data for these atlases.
Data release: By Indigenous Area, Primary Health Network, quintile of Indigenous Relative Socioeconomic Outcomes and Remoteness Area
Aboriginal & Torres Strait Islander Social Health Atlases of Australia
The topics and indicators in this latest release are listed below. Click the matrix table below to view the data and the format by which they are published.
Higher education
- School leavers enrolled in higher education (excluding Vic), 2021
Perinatal
- Low birthweight babies, 2017 to 2019
- Mothers who reported smoking during a pregnancy, 2017 to 2019
- Women who did not attend antenatal care within the first 10 weeks, 2017 to 2019
Self-assessed health (estimates) (Indigenous Area and Remoteness Area only)
- Fair or poor self-assessed health, 2018-19
- Good self-assessed health, 2018-19
- Excellent or very good self-assessed health, 2018-19
Prevalence of selected chronic diseases and conditions (estimates) (Indigenous Area and Remoteness Area only)
- Circulatory system diseases, 2018-19
- Endocrine, nutritional and metabolic diseases, 2018-19
- Respiratory system diseases, 2018-19
Prevalence of selected health risk factors (estimates) (Indigenous Area and Remoteness Area only)
- Low or moderate psychological distress, 2018-19
- High or very high psychological distress, 2018-19
- Underweight or normal (weight range) persons, 2018-19
- Overweight persons, 2018-19
- Obese persons, 2018-19
- Overweight or obese persons, 2018-19
- Current daily smokers, 2018-19
- Other smokers, 2018-19
Click hereto access the maps for these atlases.
Click hereto access the data for these atlases.
Data release: By quintile of Indigenous Relative Socioeconomic Outcomes and Remoteness Area time series
Aboriginal & Torres Strait Islander Social Health Atlases of Australia
The topics and indicators in this latest release are listed below. Click the matrix table below to view the data and the format by which they are published.
Perinatal
- Low birthweight babies, 2017 to 2019
- Mothers who reported smoking during a pregnancy, 2017 to 2019
Click hereto access the graphs for these atlases.
Click hereto access the data for these atlases.
Release: 18 May 2022
Release: Potentially preventable hospitalisations - analysis tool interview
Justin Beilby, a health services researcher and general practitioner for over 30 years provides his insights on the usefulness of PHIDU’s hot spot analysis of potentially preventable hospitalisations for health care decision making.
Click hereto access the video.
Release: Website training videos
PHIDU has created a number of new training videos including:
How to: Find a suburb or locality
This PHIDU tutorial covers how to find a suburb or locality and view its data in the Social Health Atlas of Australia and view data for over 750 indicators relating to health and the social determinants of health for that area.
How to: Produce a data profile of an area or group of areas
This PHIDU tutorial shows you how to combine different topics and indicators for an area or group of areas to create a data profile.
How to: Aggregate data to larger areas for a percent, IRSD and age standardised rate/ratio, and re-base age standardised ratio/rate
This PHIDU tutorial covers how to aggregate data to larger areas, to create a new aggregated percent, IRSD or age-standardised rate or ratio. This might be useful for creating statistics for a larger area that is specific to your project or council area for example. We will also cover how to re-base age-standardised ratios and age-standardised rates, which can be used to re-create rates based on your State or Territory, rather than on an Australian standard.
Click hereto access the videos.
Data release: 6 April 2022
Data release: Topic-Specific Atlases - COVID-19 cases, vaccination rates and selected demographic and socioeconomic status indicators
This atlas uses publicly-available data of Total case and Active case counts of COVID-19 as at late January and late March to show patterns of distribution by Local Government Area (LGA) across those States with sufficient cases to map.
It is clear that in January, socioeconomic disadvantage was a consistent influence on COVID-19 caseloads, other than in Adelaide, where only the birthplace indicator produced a notable result. In Sydney and Melbourne, cities with larger numbers of humanitarian migrants than Adelaide, correlations with Total cases are strong, and in Melbourne are also strong with Active cases. However, by March, there was a marked change in the correlations between Active cases and several of the measures shown. In particular, the correlation between Active cases and socioeconomic disadvantage (IRSD) evident in Sydney and Melbourne (both r = -0.6) is reversed, so that Sydney has a positive correlation of 0.5 and Melbourne of 0.7. These correlations suggest that it is the most advantaged populations now experiencing COVID-19.
View the data here.
Data release: Topic-Specific Atlases - Indigenous Status Comparison: Social Health Atlas of Australia
The Indigenous Status Comparison: Social Health Atlas of Australia, presents selected topics and compares indicators between Indigenous and Non-Indigenous populations in Australia. This is available by Indigenous Areas, including total for the Greater Capital City Statistical Areas/Rest of States/NT; and States/Territories.
Median age at death
- Median age at death of Indigenous/ Non-Indigenous males, females, persons, 2016 to 2020
Premature mortality by sex
- Indigenous/ Non-Indigenous males, females, persons: 0 to 54 years, 2016 to 2020
- Indigenous/ Non-Indigenous males, females, persons: 0 to 64 years, 2016 to 2020
- Indigenous/ Non-Indigenous males, females, persons: 0 to 74 years, 2016 to 2020
Premature mortality by selected cause
- Cancers, Indigenous/ Non-Indigenous persons: 0 to 54 years, 0 to 64 years, 0 to 74 years, 2016 to 2020
- - Lung cancer Indigenous/ Non-Indigenous persons: 0 to 74 years, 2016 to 2020
- Diabetes, Indigenous/ Non-Indigenous persons: 0 to 74 years, 2016 to 2020
- Circulatory system diseases, Indigenous/ Non-Indigenous persons: 0 to 54 years, 0 to 64 years, 0 to 74 years, 2016 to 2020
- - Ischaemic heart disease Indigenous/ Non-Indigenous persons: 0 to 74 years, 2016 to 2020
- Respiratory system diseases, Indigenous/ Non-Indigenous persons: 0 to 54 years, 0 to 64 years, 0 to 74 years, 2016 to 2020
- - Chronic obstructive pulmonary disease (COPD) Indigenous/ Non-Indigenous persons: 0 to 74 years, 2016 to 2020
- External causes, Indigenous/ Non-Indigenous persons: 0 to 54 years, 0 to 64 years, 0 to 74 years, 2016 to 2020
- - Road traffic injuries Indigenous/ Non-Indigenous persons: 0 to 74 years, 2016 to 2020
- - Suicide and self-inflicted injuries Indigenous/ Non-Indigenous persons: 0 to 74 years, 2016 to 2020
Avoidable mortality by sex
- Deaths from all avoidable causes, Indigenous/ Non-Indigenous males, females, persons aged 0 to 74 years, 2016 to 2020
Avoidable mortality by selected cause
- Avoidable deaths from cancer, Indigenous/ Non-Indigenous persons aged 0 to 74 years, 2016 to 2020
- Avoidable deaths from diabetes, Indigenous/ Non-Indigenous persons aged 0 to 74 years, 2016 to 2020
- Avoidable deaths from circulatory system diseases, Indigenous/ Non-Indigenous persons aged 0 to 74 years, 2016 to 2020
- - Ischaemic heart disease, Indigenous/ Non-Indigenous persons aged 0 to 74 years, 2016 to 2020
- Avoidable deaths from respiratory system diseases, Indigenous/ Non-Indigenous persons aged 0 to 74 years, 2016 to 2020
- - Chronic obstructive pulmonary disease (COPD), Indigenous/ Non-Indigenous persons aged 0 to 74 years, 2016 to 2020
- Avoidable deaths from selected external causes, Indigenous/ Non-Indigenous persons aged 0 to 74 years, 2016 to 2020
- - Suicide and self-inflicted injuries, Indigenous/ Non-Indigenous persons aged 0 to 74 years, 2016 to 2020
- Avoidable deaths from other external causes, Indigenous/ Non-Indigenous aged 0 to 74 years, 2016 to 2020
- - Transport accidents, Indigenous/ Non-Indigenous persons aged 0 to 74 years, 2016 to 2020
Potential years of life lost by age and sex
- Indigenous/ Non-Indigenous males, females, persons aged 0 to 54 years, 2016 to 2020
- Indigenous/ Non-Indigenous males, females, persons aged 0 to 64 years, 2016 to 2020
- Indigenous/ Non-Indigenous males, females, persons aged 0 to 74 years, 2016 to 2020
Potential years of life lost by selected cause
- Potential years of life lost from cancer Indigenous/ Non-Indigenous persons, 2016 to 2020
- - Potential years of life lost lung cancer Indigenous/ Non-Indigenous persons, 2016 to 2020
- Potential years of life lost from diabetes Indigenous/ Non-Indigenous persons, 2016 to 2020
- Potential years of life lost from circulatory system diseases Indigenous/ Non-Indigenous persons, 2016 to 2020
- - Potential years of life lost ischaemic heart disease Indigenous/ Non-Indigenous persons, 2016 to 2020
- Potential years of life lost from respiratory system diseases Indigenous/ Non-Indigenous persons, 2016 to 2020
- - Potential years of life lost chronic obstructive pulmonary disease (COPD) Indigenous/ Non-Indigenous persons, 2016 to 2020
- Potential years of life lost from external causes Indigenous/ Non-Indigenous persons, 2016 to 2020
- - Potential years of life lost road traffic injuries Indigenous/ Non-Indigenous persons, 2016 to 2020
- - Potential years of life lost suicide and self-inflicted injuries Indigenous/ Non-Indigenous persons, 2016 to 2020
Click hereto access the maps for these atlases.
Click hereto access the data for these atlases.
Data release: By Population Health Area, Local Government Area, Primary Health Network, quintile of socioeconomic disadvantage of area (including within Primary Health Network) and Remoteness Area
Social Health Atlases of Australia
The topics and indicators in this latest release are listed below. Click the matrix table below to view the data and the format by which they are published.
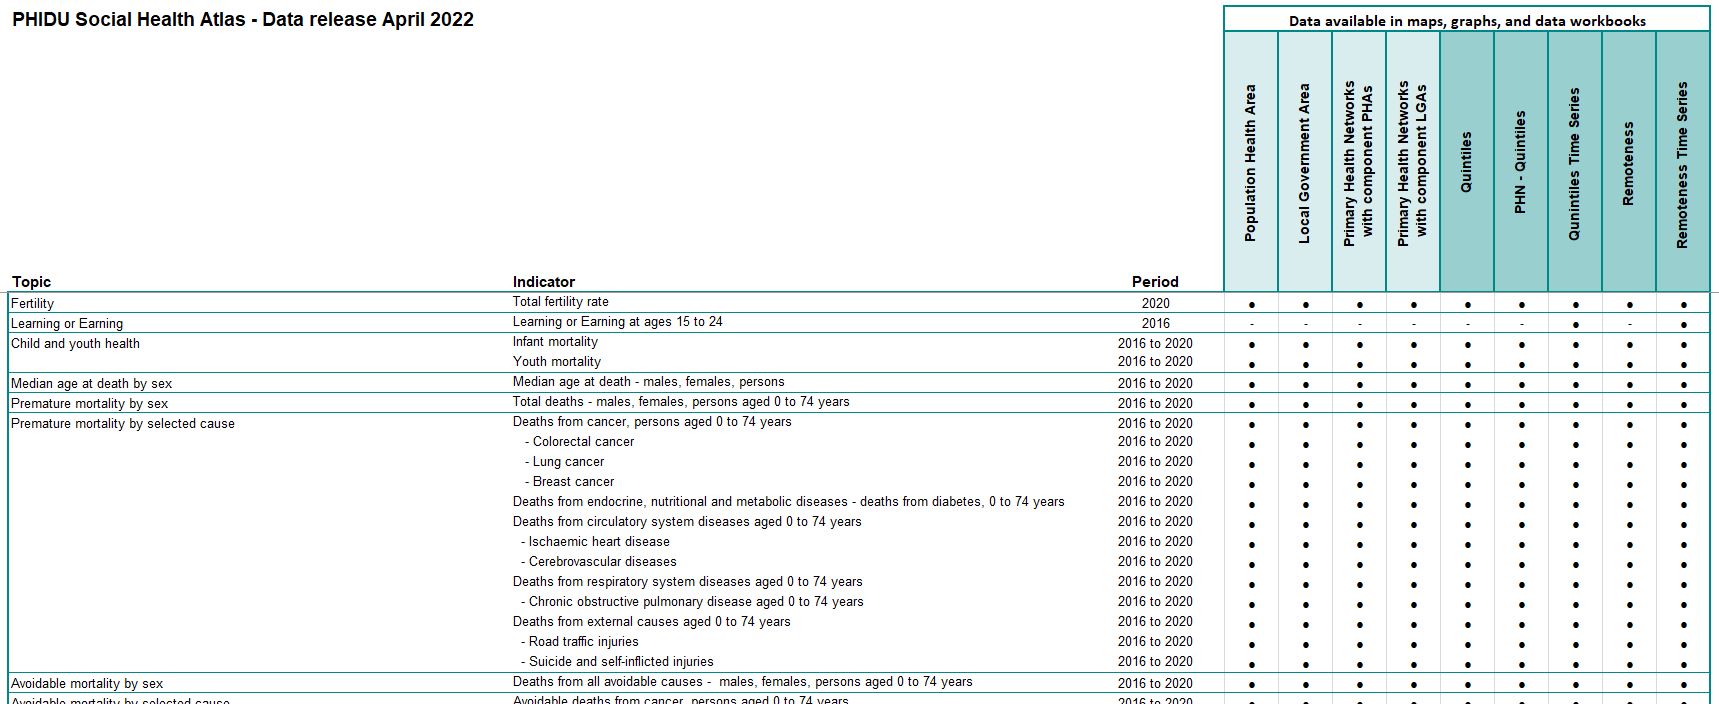
Fertility rate
- Total fertility rate, 2020
Child and youth health
- Infant mortality, 2016 to 2020
- Youth mortality, 2016 to 2020
Median age at death by sex
- Median age at death of males, females, persons, 2016 to 2020
Premature mortality by sex
- Deaths of males, females, persons aged 0 to 74 years, 2016 to 2020
Premature mortality by selected cause
- Deaths from cancer, persons aged 0 to 74 years, 2016 to 2020
- - Colorectal cancer, 2016 to 2020
- - Lung cancer, 2016 to 2020
- - Breast cancer, 2016 to 2020
- Deaths from endocrine, nutritional and metabolic diseases - deaths from diabetes, 0 to 74 years, 2016 to 2020
- Deaths from circulatory system diseases aged 0 to 74 years, 2016 to 2020
- - Ischaemic heart disease, 2016 to 2020
- - Cerebrovascular diseases, 2016 to 2020
- Deaths from respiratory system diseases aged 0 to 74 years, 2016 to 2020
- - Chronic obstructive pulmonary disease (COPD) aged 0 to 74 years, 2016 to 2020
- Deaths from external causes aged 0 to 74 years, 2016 to 2020
- - Road traffic injuries, 2016 to 2020
- - Suicide and self -inflicted injuries, 2016 to 2020
Avoidable mortality by sex
- Deaths from all avoidable causes, males, females, persons aged 0 to 74 years, 2016 to 2020
Avoidable mortality by selected cause
- Avoidable deaths from cancer, persons aged 0 to 74 years, 2016 to 2020
- - Colorectal cancer, 2016 to 2020
- - Breast cancer, 2016 to 2020
- Avoidable deaths from diabetes aged 0 to 74 years, 2016 to 2020
- Avoidable deaths from circulatory system diseases aged 0 to 74 years, 2016 to 2020
- - Ischaemic heart disease, 2016 to 2020
- - Cerebrovascular diseases, 2016 to 2020
- Avoidable deaths from respiratory system diseases aged 0 to 74 years, 2016 to 2020
- - Chronic obstructive pulmonary disease (COPD), 2016 to 2020
- Avoidable deaths from selected external causes of mortality aged 0 to 74 years, 2016 to 2020
- - Suicide and self -inflicted injuries, 2016 to 2020
- Avoidable deaths from other external causes of mortality aged 0 to 74 years, 2016 to 2020
- - Transport accidents, 2016 to 2020
Potential years of life lost by sex
- Potential years of life lost, males, 2016 to 2020
- Potential years of life lost, females, 2016 to 2020
- Potential years of life lost, persons, 2016 to 2020
Potential years of life lost, males, females, persons by age
- Males, females, persons: broad age groups, 2016 to 2020
Potential years of life lost by selected cause
- Potential years of life lost from cancer, 2016 to 2020
- - Colorectal cancer, 2016 to 2020
- - Lung cancer, 2016 to 2020
- - Breast cancer, 2016 to 2020
- Potential years of life lost from diabetes, 2016 to 2020
- Potential years of life lost from circulatory system diseases, 2016 to 2020
- - Ischaemic heart disease, 2016 to 2020
- - Cerebrovascular diseases, 2016 to 2020
- Potential years of life lost from respiratory system diseases, 2016 to 2020
- - Chronic obstructive pulmonary disease (COPD), 2016 to 2020
- Potential years of life lost from external causes, 2016 to 2020
- - Road traffic injuries, 2016 to 2020
- - Suicide and self -inflicted injuries, 2016 to 2020
Click hereto access the maps for these atlases.
Click hereto access the data for these atlases.
Data release: By quintile of socioeconomic disadvantage of area and Remoteness Area time series
Social Health Atlases of Australia
The topics and indicators in this latest release are listed below. Click the matrix table below to view the data and the format by which they are published.
Fertility rate
- Total fertility rate, 2020
Learning or Earning
- Learning or Earning at ages 15 to 24 (Time series only), 2016
Child and youth health
- Infant mortality, 2016 to 2020
- Youth mortality, 2016 to 2020
Median age at death by sex
- Median age at death of males, females, persons, 2016 to 2020
Premature mortality by sex
- Deaths of males, females, persons aged 0 to 74 years, 2016 to 2020
Premature mortality by selected cause
- Deaths from cancer, persons aged 0 to 74 years, 2016 to 2020
- - Colorectal cancer, 2016 to 2020
- - Lung cancer, 2016 to 2020
- - Breast cancer, 2016 to 2020
- Deaths from endocrine, nutritional and metabolic diseases - deaths from diabetes, 0 to 74 years, 2016 to 2020
- Deaths from circulatory system diseases aged 0 to 74 years, 2016 to 2020
- - Ischaemic heart disease, 2016 to 2020
- - Cerebrovascular diseases, 2016 to 2020
- Deaths from respiratory system diseases aged 0 to 74 years, 2016 to 2020
- - Chronic obstructive pulmonary disease (COPD) aged 0 to 74 years, 2016 to 2020
- Deaths from external causes aged 0 to 74 years, 2016 to 2020
- - Road traffic injuries, 2016 to 2020
- - Suicide and self -inflicted injuries, 2016 to 2020
Avoidable mortality by sex
- Deaths from all avoidable causes, males, females, persons aged 0 to 74 years, 2016 to 2020
Avoidable mortality by selected cause
- Avoidable deaths from cancer, persons aged 0 to 74 years, 2016 to 2020
- - Colorectal cancer, 2016 to 2020
- - Breast cancer, 2016 to 2020
- Avoidable deaths from diabetes aged 0 to 74 years, 2016 to 2020
- Avoidable deaths from circulatory system diseases aged 0 to 74 years, 2016 to 2020
- - Ischaemic heart disease, 2016 to 2020
- - Cerebrovascular diseases, 2016 to 2020
- Avoidable deaths from respiratory system diseases aged 0 to 74 years, 2016 to 2020
- - Chronic obstructive pulmonary disease (COPD), 2016 to 2020
- Avoidable deaths from selected external causes of mortality aged 0 to 74 years, 2016 to 2020
- - Suicide and self -inflicted injuries, 2016 to 2020
- Avoidable deaths from other external causes of mortality aged 0 to 74 years, 2016 to 2020
- - Transport accidents, 2016 to 2020
Potential years of life lost by sex
- Potential years of life lost, males, 2016 to 2020
- Potential years of life lost, females, 2016 to 2020
- Potential years of life lost, persons, 2016 to 2020
Potential years of life lost, males, females, persons by age
- Males, females, persons: broad age groups, 2016 to 2020
Potential years of life lost by selected cause
- Potential years of life lost from cancer, 2016 to 2020
- - Colorectal cancer, 2016 to 2020
- - Lung cancer, 2016 to 2020
- - Breast cancer, 2016 to 2020
- Potential years of life lost from diabetes, 2016 to 2020
- Potential years of life lost from circulatory system diseases, 2016 to 2020
- - Ischaemic heart disease, 2016 to 2020
- - Cerebrovascular diseases, 2016 to 2020
- Potential years of life lost from respiratory system diseases, 2016 to 2020
- - Chronic obstructive pulmonary disease (COPD), 2016 to 2020
- Potential years of life lost from external causes, 2016 to 2020
- - Road traffic injuries, 2016 to 2020
- - Suicide and self -inflicted injuries, 2016 to 2020
Click hereto access the graphs for these atlases.
Click hereto access the data for these atlases.
Data release: By Indigenous Area, Primary Health Network, quintile of Indigenous Relative Socioeconomic Outcomes and Remoteness Area
Aboriginal & Torres Strait Islander Social Health Atlases of Australia
The topics and indicators in this latest release are listed below. Click the matrix table below to view the data and the format by which they are published.
Median age at death
- Median age at death of Aboriginal males, females, persons, 2016 to 2020
Premature mortality by sex
- Males, females, persons: 0 to 54 years, 2016 to 2020
- Males, females, persons: 0 to 64 years, 2016 to 2020
- Males, females, persons: 0 to 74 years, 2016 to 2020
Premature mortality by selected cause
- Cancers, persons: 0 to 54 years, 0 to 64 years, 0 to 74 years, 2016 to 2020
- - Lung cancer persons: 0 to 74 years, 2016 to 2020
- Diabetes, persons: 0 to 74 years, 2016 to 2020
- Circulatory system diseases, persons: 0 to 54 years, 0 to 64 years, 0 to 74 years, 2016 to 2020
- - Ischaemic heart disease persons: 0 to 74 years, 2016 to 2020
- Respiratory system diseases, persons: 0 to 64 years, 0 to 74 years, 2016 to 2020
- - Chronic obstructive pulmonary disease (COPD) persons: 0 to 74 years, 2016 to 2020
- External causes, persons: 0 to 54 years, 0 to 64 years, 0 to 74 years, 2016 to 2020
- - Road traffic injuries persons: 0 to 74 years, 2016 to 2020
- - Suicide and self-inflicted injuries persons: 0 to 74 years, 2016 to 2020
Avoidable mortality by sex
- Deaths from all avoidable causes, males, females, persons aged 0 to 74 years, 2016 to 2020
Avoidable mortality by selected cause
- Avoidable deaths from cancer, persons aged 0 to 74 years, 2016 to 2020
- Avoidable deaths from diabetes, persons aged 0 to 74 years, 2016 to 2020
- Avoidable deaths from circulatory system diseases, persons aged 0 to 74 years, 2016 to 2020
- - Ischaemic heart disease, 2016 to 2020
- Avoidable deaths from respiratory system diseases, persons aged 0 to 74 years, 2016 to 2020
- - Chronic obstructive pulmonary disease (COPD), 2016 to 2020
- Avoidable deaths from selected external causes, persons aged 0 to 74 years, 2016 to 2020
- - Suicide and self-inflicted injuries, 2016 to 2020
- Avoidable deaths from other external causes, persons aged 0 to 74 years, 2016 to 2020
- - Transport accidents, 2016 to 2020
Potential years of life lost by age and sex
- Males, females, persons: 0 to 54 years, 2016 to 2020
- Males, females, persons: 0 to 64 years, 2016 to 2020
- Males, females, persons: 0 to 74 years, 2016 to 2020
Potential years of life lost by selected cause
- Potential years of life lost from cancer, 2016 to 2020
- - Lung cancer, 2016 to 2020
- Potential years of life lost from diabetes, 2016 to 2020
- Potential years of life lost from circulatory system diseases, 2016 to 2020
- - Ischaemic heart disease, 2016 to 2020
- Potential years of life lost from respiratory system diseases, 2016 to 2020
- - Chronic obstructive pulmonary disease (COPD), 2016 to 2020
- Potential years of life lost from external causes, 2016 to 2020
- - Road traffic injuries, 2016 to 2020
- - Suicide and self-inflicted injuries, 2016 to 2020
Click hereto access the maps for these atlases.
Click hereto access the data for these atlases.
Data release: By quintile of Indigenous Relative Socioeconomic Outcomes and Remoteness Area time series
Aboriginal & Torres Strait Islander Social Health Atlases of Australia
The topics and indicators from the Aboriginal & Torres Strait Islander Social Health Atlas of Australia quintile of Indigenous Relative Socioeconomic Outcomes and Remoteness Areas have now been released by time series.
Click hereto access the graphs for these atlases.
Click hereto access the data for these atlases.
Data release: 28 March 2022
Data release: Topic-Specific Atlases - COVID-19 vaccination rates and case data by Local Government Area - now with data for children
These data show the challenge remaining to increase vaccination coverage in young children and Aboriginal and Torres Strait Islander people and to encourage those with English as a second language and other disadvantaged groups to have a booster (third) dose. Data are also provided for Total cases and Active cases for selected capital cities: these show a marked turn around in the population groups being infected. The atlases highlight geographic variations and provide comparisons with a range of demographic and socioeconomic status indicators.
Click hereto access the atlases.
Data release: 17 February 2022
Data release: Topic-Specific Atlases - COVID-19 vaccination rates and case data by Local Government Area - now includes vaccination rate for Aboriginal and Torres Strait Islanders
This atlas has been updated up to early February and now includes vaccination rate for Aboriginal and Torres Strait Islanders by Local Government Area (LGA).
Click hereto access the atlases.
Data release: 17 January 2022
Data release: Topic-Specific Atlases - COVID-19 vaccination rates by Local Government Area (whole population) and Regional areas (Aboriginal and Torres Strait Islander people and whole population), including Time Series - Updated
This atlas has been updated up to early January.
Click hereto access the atlases.
2021
Data release: 14 December 2021
Atlases
Data release: Topic-Specific Atlases - COVID-19 vaccination rates by Local Government Area (whole population) and Regional areas (Aboriginal and Torres Strait Islander people and whole population), including Time Series - Updated
The change in the correlations at the Local Government Area level between high rates of those fully-vaccinated and high socioeconomic status in Sydney and Melbourne, from a very strong association on 27 August to no association on 13 December shows the effectiveness of the targeted strategies undertaken in those cities. In contrast, the very strong association with high socioeconomic status in Adelaide, Brisbane and Perth on 27 August, cities with lower overall vaccination rates, remains unchanged, underlining the challenges remaining.
There are marked gaps in each state between vaccination rates for Aboriginal and Torres Strait Islander people and all Australians. The gap varies from 7 percentage points in Victoria to 20 percentage points in Queensland with an overall vaccination rate of 87.4% compared with 68.9% for Aboriginal and Torres Strait Islander people.
View the data here.
Data release: By Population Health Area, Local Government Area, Primary Health Network, quintile of socioeconomic disadvantage of area (including within Primary Health Networks) and Remoteness Area
Social Health Atlases of Australia
The topics and indicators in this latest release are listed below. Click the matrix table below to view the data and the format by which they are published.
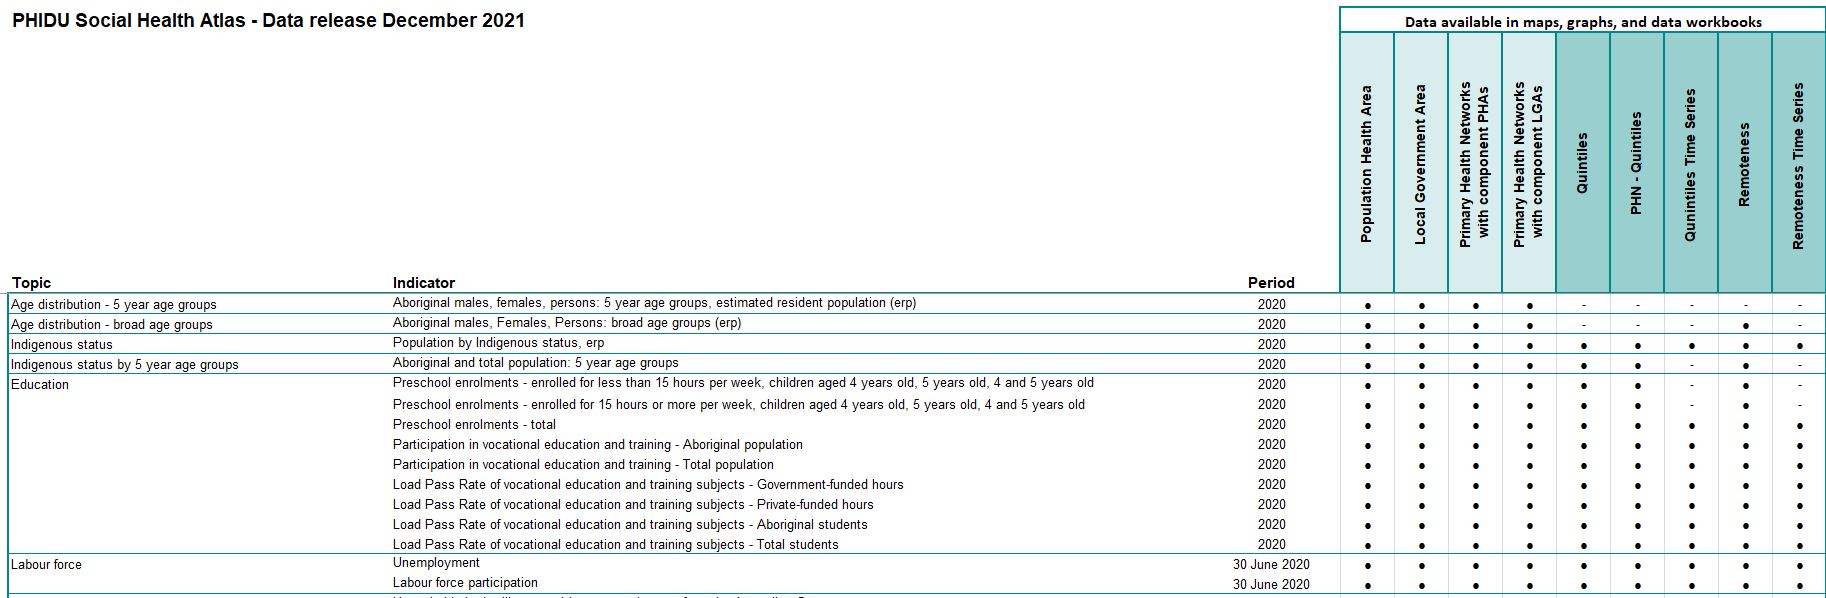
Age distribution - 5 year age groups
- Aboriginal males, females, persons: 5 year age groups, estimated resident population (erp), 2020
Age distribution - broad age groups
- Aboriginal males, females, persons: broad age groups (erp), 2020
Indigenous status
- Population by Indigenous status (erp), 2020
Indigenous status by 5 year age groups
- Aboriginal and total population: 5 year age groups (erp), 2020
Education
- Preschool enrolments - enrolled for less than 15 hours per week, children aged 4 years old, 5 years old, 4 and 5 years old, 2020
- Preschool enrolments - enrolled for 15 hours or more per week, children aged 4 years old, 5 years old, 4 and 5 years old, 2020
- Preschool enrolments - total, children aged 4 years old, 5 years old, 4 and 5 years old, 2020
- Participation in vocational education and training - Aboriginal population, 2020
- Participation in vocational education and training - Total population, 2020
- Load Pass Rate of vocational education and training subjects - Government-funded hours, 2020
- Load Pass Rate of vocational education and training subjects - Private-funded hours, 2020
- Load Pass Rate of vocational education and training subjects - Aboriginal students, 2020
- Load Pass Rate of vocational education and training subjects - Total students, 2020
Labour force
- Unemployment, 30 June 2020
- Labour force participation, 30 June 2020
Housing, rent assistance and vehicle access
- Aboriginal households in dwellings receiving rent assistance from the Australian Government, June 2021
Income support recipients
- Female sole parent pensioners, June 2021
- Short-term unemployment beneficiaries, June 2021
- Long-term unemployment beneficiaries, June 2021
- Low income families (with children), June 2021
- Children in low income families, June 2021
Data release: By quintile of socioeconomic disadvantage of area time series and Remoteness Area time series
Social Health Atlases of Australia
The topics and indicators in this latest release are listed below. Click the matrix table below to view the data and the format by which they are published.
Indigenous status
- Population by Indigenous status, estimated resident population, 2020
Education
- Preschool enrolments - total, 2020
- Participation in vocational education and training - Aboriginal population, 2020
- Participation in vocational education and training - Total population, 2020
- Load Pass Rate of vocational education and training subjects - Government-funded hours, 2020
- Load Pass Rate of vocational education and training subjects - Private-funded hours, 2020
- Load Pass Rate of vocational education and training subjects - Aboriginal students, 2020
- Load Pass Rate of vocational education and training subjects - Total students, 2020
Labour force
- Unemployment, 30 June 2020
- Labour force participation, 30 June 2020
Housing, rent assistance and vehicle access
- Households in dwellings receiving rent assistance from the Australian Government, June 2021
- Aboriginal households in dwellings receiving rent assistance from the Australian Government, June 2021
Income support recipients
- Age pensioners, June 2021
- Disability support pensioners, June 2021
- Female sole parent pensioners, June 2021
- Unemployment beneficiaries, June 2021
- Youth unemployment beneficiaries, June 2021
- Short-term unemployment beneficiaries, June 2021
- Long-term unemployment beneficiaries, June 2021
- Health Care Card holders, June 2021
- Pensioner Concession Card holders, June 2021
- Seniors Health Card holders, June 2021
Child and youth health
- Infant mortality, 2015 to 2019
- Youth mortality, 2015 to 2019
Median age at death by sex
- Median age at death of males, females, persons, 2015 to 2019 (quintiles of socioeconomic disadvantage only)
Premature mortality by sex
- Deaths of males, females, persons aged 0 to 74 years, 2015 to 2019
Premature mortality by selected cause
- Deaths from cancer, persons aged 0 to 74 years, 2015 to 2019
- Deaths from colorectal cancer, persons aged 0 to 74 years, 2015 to 2019
- Deaths from lung cancer, persons aged 0 to 74 years, 2015 to 2019
- Deaths from breast cancer, persons aged 0 to 74 years, 2015 to 2019
- Deaths from endocrine, nutritional and metabolic diseases - deaths from diabetes, 0 to 74 years, 2015 to 2019
- Deaths from circulatory system diseases aged 0 to 74 years, 2015 to 2019
- Deaths from ischaemic heart disease, persons aged 0 to 74 years, 2015 to 2019
- Deaths from cerebrovascular diseases, persons aged 0 to 74 years, 2015 to 2019
- Deaths from respiratory system diseases aged 0 to 74 years, 2015 to 2019
- Deaths from chronic obstructive pulmonary disease (COPD) aged 0 to 74 years, 2015 to 2019
- Deaths from external causes aged 0 to 74 years, 2015 to 2019
- Deaths from road traffic injuries, persons aged 0 to 74 years, 2015 to 2019
- Deaths from suicide and self-inflicted injuries, persons aged 0 to 74 years, 2015 to 2019
Avoidable mortality by sex
- Deaths from all avoidable causes, males, females, persons aged 0 to 74 years, 2015 to 2019
Avoidable mortality by selected cause
- Avoidable deaths from cancer, persons aged 0 to 74 years, 2015 to 2019
- Avoidable deaths from colorectal cancer, persons aged 0 to 74 years, 2015 to 2019
- Avoidable deaths from breast cancer, persons aged 0 to 74 years, 2015 to 2019
- Avoidable deaths from diabetes aged 0 to 74 years, 2015 to 2019
- Avoidable deaths from circulatory system diseases aged 0 to 74 years, 2015 to 2019
- Avoidable deaths from ischaemic heart disease, persons aged 0 to 74 years, 2015 to 2019
- Avoidable deaths from cerebrovascular diseases, persons aged 0 to 74 years, 2015 to 2019
- Avoidable deaths from respiratory system diseases aged 0 to 74 years, 2015 to 2019
- Avoidable deaths from chronic obstructive pulmonary disease (COPD), persons aged 0 to 74 years, 2015 to 2019
- Avoidable deaths from selected external causes of mortality aged 0 to 74 years, 2015 to 2019
- Avoidable deaths from suicide and self-inflicted injuries, persons aged 0 to 74 years, 2015 to 2019
- Avoidable deaths from other external causes of mortality aged 0 to 74 years, persons aged 0 to 74 years, 2015 to 2019
- Avoidable deaths from transport accidents, persons aged 0 to 74 years, 2015 to 2019
Admissions by hospital type and sex
- Total admissions - Public, All hospitals - males, females, persons, 2018/19
Admissions by principal diagnosis - Males, females, persons
- Infectious and parasitic diseases - Public hospitals, 2018/19
- All cancers - Public hospitals, 2018/19
- Endocrine, nutritional and metabolic diseases - Public hospitals, 2018/19
- mental health-related conditions - Public hospitals, 2018/19
- Nervous system diseases - Public hospitals, 2018/19
- Eye and adnexa diseases - Public hospitals, 2018/19
- Ear and mastoid process diseases - Public hospitals, 2018/19
- Circulatory system diseases - Public hospitals, 2018/19
- Respiratory system diseases - Public hospitals, 2018/19
- Digestive system diseases - Public hospitals, 2018/19
- Skin and subcutaneous tissue diseases - Public hospitals, 2018/19
- Musculoskeletal system and connective tissue diseases - Public hospitals, 2018/19
- Genitourinary system diseases - Public hospitals, 2018/19
- Pregnancy and childbirth 15 to 44 years - Public hospitals, 2018/19
- Certain conditions originating in the perinatal period - Public hospitals, 2018/19
- Congenital malformations, deformations and chromosomal abnormalities - Public hospitals, 2018/19
- Injury, poisoning and other external causes - Public hospitals, 2018/19
Admissions by procedure type
- Tonsillectomy - Public hospitals, 2018/19
- Myringotomy, 0 to 9 years - Public hospitals, 2018/19
- Hysterectomy, females aged 30 to 59 years - Public hospitals, 2018/19
- Caesarean section, females aged 15 to 44 years - Public hospitals, 2018/19
- Coronary artery bypass graft - Public hospitals, 2018/19
- Coronary angioplasty - Public hospitals, 2018/19
- Cardiac catheterisation - Public hospitals, 2018/19
- Hip fracture - Public hospitals, 2018/19
- Knee replacement - Public hospitals, 2018/19
- Knee arthroscopy - Public hospitals, 2018/19
- Fibre optic colonoscopy - Public hospitals, 2018/19
- Fibre optic colonoscopy excision - Public hospitals, 2018/19
Same-day admissions for renal dialysis
- Same-day dialysis for kidney disease - Public hospitals, 2018/19
Potentially preventable hospitalisations - All conditions
- Public potentially preventable conditions - Public hospitals, 2018/19
Potentially preventable hospitalisations - Vaccine-preventable
- Vaccine-preventable conditions - pneumonia and influenza - Public hospitals, 2018/19
- Total vaccine-preventable conditions - Public hospitals, 2018/19
Potentially preventable hospitalisations - Acute conditions
- Acute cellulitis - Public hospitals, 2018/19
- Acute convulsions and epilepsy - Public hospitals, 2018/19
- Acute dental conditions - Public hospitals, 2018/19
- Acute ear, nose and throat infections - Public hospitals, 2018/19
- Acute urinary tract infections, including pyelonephritis - Public hospitals, 2018/19
- Total acute conditions - Public hospitals, 2018/19
Potentially preventable hospitalisations - Chronic conditions
- Chronic angina - Public hospitals, 2018/19
- Chronic asthma - Public hospitals, 2018/19
- Chronic congestive cardiac failure - Public hospitals, 2018/19
- Chronic obstructive pulmonary disease (COPD) - Public hospitals, 2018/19
- Chronic diabetes complications - Public hospitals, 2018/19
- Chronic iron deficiency anaemia - Public hospitals, 2018/19
- Total chronic conditions - Public hospitals, 2018/19
Emergency department presentations
- Emergency department presentations, 2018/19
Fact sheets
Data release: Fact sheets - Deaths from non-communicable diseases are over represented in disadvantaged areas
Deaths data are a vital measure of a population’s health providing information on patterns of disease that cause death. Deaths by non-communicable diseases (NCDs) represent an overwhelming majority of all deaths, with the most common conditions being related to cardiovascular and respiratory systems, as well as cancer and diabetes.
Click here to access the fact sheet.
Data release: 26 October 2021
Atlases
Data release: By Indigenous Area, Primary Health Networks, quintile of Indigenous Relative Socioeconomic Outcomes and Remoteness Areas
Aboriginal & Torres Strait Islander Social Health Atlases of Australia
The topics and indicators in this latest release are listed below. Click the matrix table below to view the data and the format by which they are published.
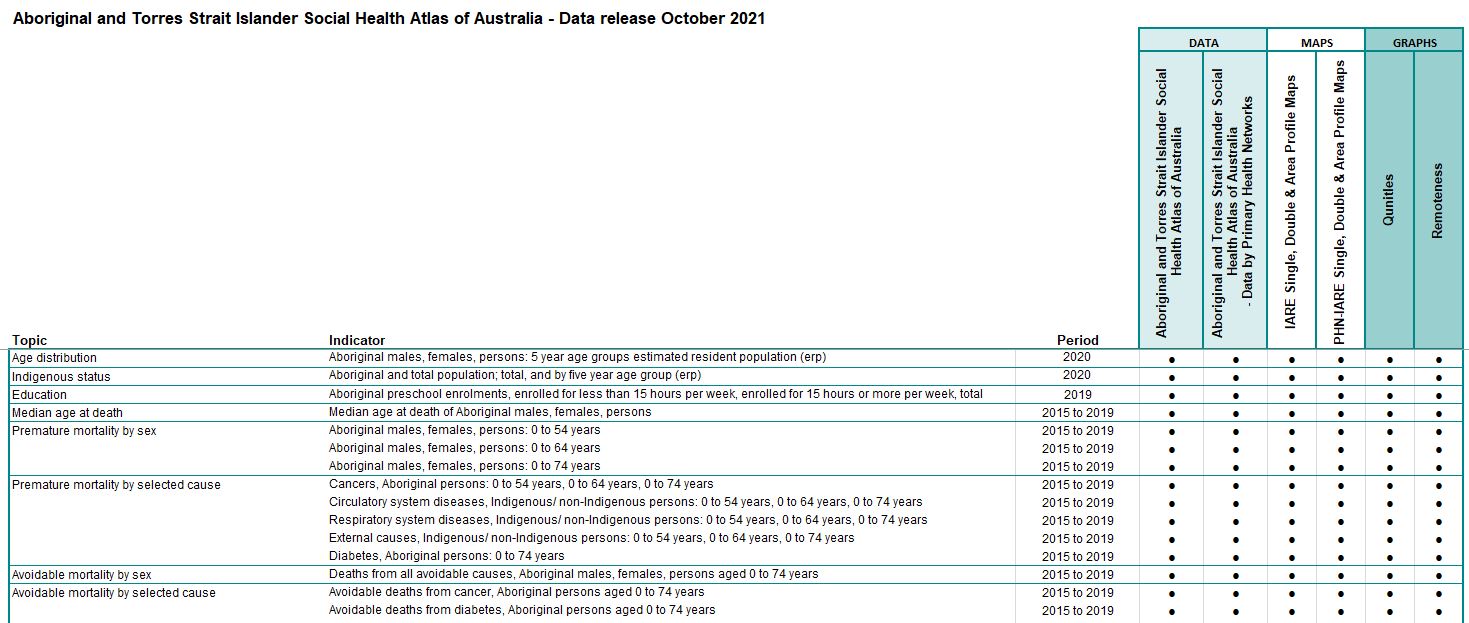
Age distribution
- Aboriginal males, females, persons: 5 year age groups, estimated resident population (erp) 2020
Indigenous status
- Aboriginal and total population; total, and by five year age group, (erp) 2020
Education
- Aboriginal preschool enrolments, enrolled for less than 15 hours per week, enrolled for 15 hours or more per week, total, 2020
Median age at death
- Median age at death of Aboriginal males, females, persons, 2015 to 2019
Premature mortality by sex
- Aboriginal males, females, persons: 0 to 54 years, 2015 to 2019
- Aboriginal males, females, persons: 0 to 64 years, 2015 to 2019
- Aboriginal males, females, persons: 0 to 74 years, 2015 to 2019
Premature mortality by selected cause
- Cancers, Aboriginal persons: 0 to 54 years, 0 to 64 years, 0 to 74 years, 2015 to 2019
- Circulatory system diseases, Aboriginal persons: 0 to 54 years, 0 to 64 years, 0 to 74 years, 2015 to 2019
- Respiratory system diseases, Aboriginal persons: 0 to 54 years, 0 to 64 years, 0 to 74 years, 2015 to 2019
- External causes, Aboriginal persons: 0 to 54 years, 0 to 64 years, 0 to 74 years, 2015 to 2019
- Diabetes, Aboriginal persons: 0 to 74 years, 2015 to 2019
Avoidable mortality by sex
- Deaths from all avoidable causes, Aboriginal males, females, persons aged 0 to 74 years, 2015 to 2019
Avoidable mortality by selected cause
- Avoidable deaths from cancer, Aboriginal persons aged 0 to 74 years, 2015 to 2019
- Avoidable deaths from diabetes, Aboriginal persons aged 0 to 74 years, 2015 to 2019
- Avoidable deaths from circulatory system diseases, Aboriginal persons aged 0 to 74 years, 2015 to 2019
- Avoidable deaths from respiratory system diseases, Aboriginal persons aged 0 to 74 years, 2015 to 2019
- Avoidable deaths from selected external causes, Aboriginal persons aged 0 to 74 years, 2015 to 2019
- Avoidable deaths from other external causes, Aboriginal persons aged 0 to 74 years, 2015 to 2019
Potential years of life lost by age and sex
- Aboriginal males, females, persons aged 0 to 54 years, 2015 to 2019
- Aboriginal males, females, persons aged 0 to 64 years, 2015 to 2019
- Aboriginal males, females, persons aged 0 to 74 years, 2015 to 2019
Potential years of life lost by selected cause
- Potential years of life lost from cancer, 2015 to 2019
- Potential years of life lost from diabetes, 2015 to 2019
- Potential years of life lost from circulatory system diseases, 2015 to 2019
- Potential years of life lost from respiratory system diseases, 2015 to 2019
- Potential years of life lost from external causes, 2015 to 2019
Click hereto access the maps for these atlases.
Click hereto access the data for these atlases.
Data release: Indigenous Status Comparison: Social Health Atlas of Australia: By quintile of socioeconomic disadvantage of area and Remoteness Area
The topics and indicators from the Indigenous Status Comparison: Social Health Atlas of Australia have now been released by quintile of socioeconomic disadvantage of area and Remoteness Area
Click hereto access the graphs for this atlas.
Click hereto access the data for this atlas.
Data release: Topic-Specific Atlases - Indigenous Status Comparison: Social Health Atlas of Australia
The Indigenous Status Comparison: Social Health Atlas of Australia, presents selected topics and compares indicators between Indigenous and Non-Indigenous populations in Australia. This is available by Indigenous Areas, including total for the Greater Capital City Statistical Areas/Rest of States/NT; and States/Territories.
Age distribution
- Indigenous/ Non-Indigenous males, females, persons: 5 year age groups, estimated resident population, (erp) 2020
Indigenous status
- Indigenous/ Non-Indigenous status total population; total, and by five year age group , (erp) 2020
Education
- Indigenous/ Non-Indigenous preschool enrolments, enrolled for less than 15 hours per week, enrolled for 15 hours or more per week, total, 2020
Median age at death
- Median age at death of Indigenous/ Non-Indigenous males, females, persons, 2015 to 2019
Premature mortality by sex
- Indigenous/ Non-Indigenous males, females, persons: 0 to 54 years, 2015 to 2019
- Indigenous/ Non-Indigenous males, females, persons: 0 to 64 years, 2015 to 2019
- Indigenous/ Non-Indigenous males, females, persons: 0 to 74 years, 2015 to 2019
Premature mortality by selected cause
- Cancers, Indigenous/ Non-Indigenous persons: 0 to 54 years, 0 to 64 years, 0 to 74 years, 2015 to 2019
- Circulatory system diseases, Indigenous/ Non-Indigenous persons: 0 to 54 years, 0 to 64 years, 0 to 74 years, 2015 to 2019
- Respiratory system diseases, Indigenous/ Non-Indigenous persons: 0 to 54 years, 0 to 64 years, 0 to 74 years, 2015 to 2019
- External causes, Indigenous/ Non-Indigenous persons: 0 to 54 years, 0 to 64 years, 0 to 74 years, 2015 to 2019
- Diabetes, Indigenous/ Non-Indigenous persons: 0 to 74 years, 2015 to 2019
Avoidable mortality by sex
- Deaths from all avoidable causes, Indigenous/ Non-Indigenous males, females, persons aged 0 to 74 years, 2015 to 2019
Avoidable mortality by selected cause
- Avoidable deaths from cancer, Indigenous/ Non-Indigenous persons aged 0 to 74 years, 2015 to 2019
- Avoidable deaths from diabetes, Indigenous/ Non-Indigenous persons aged 0 to 74 years, 2015 to 2019
- Avoidable deaths from circulatory system diseases, Indigenous/ Non-Indigenous persons aged 0 to 74 years, 2015 to 2019
- Avoidable deaths from respiratory system diseases, Indigenous/ Non-Indigenous persons aged 0 to 74 years, 2015 to 2019
- Avoidable deaths from selected external causes, Indigenous/ Non-Indigenous persons aged 0 to 74 years, 2015 to 2019
- Avoidable deaths from other external causes, Indigenous/ Non-Indigenous aged 0 to 74 years, 2015 to 2019
Potential years of life lost by age and sex
- Indigenous/ Non-Indigenous males, females, persons aged 0 to 54 years, 2015 to 2019
- Indigenous/ Non-Indigenous males, females, persons aged 0 to 64 years, 2015 to 2019
- Indigenous/ Non-Indigenous males, females, persons aged 0 to 74 years, 2015 to 2019
Potential years of life lost by selected cause
- Potential years of life lost from cancer, 2015 to 2019
- Potential years of life lost from diabetes, 2015 to 2019
- Potential years of life lost from circulatory system diseases, 2015 to 2019
- Potential years of life lost from respiratory system diseases, 2015 to 2019
- Potential years of life lost from external causes, 2015 to 2019
Click hereto access this atlas.
Data release: By quintile of socioeconomic disadvantage of area within Primary Health Networks (PHNs); amendment
Social Health Atlases of Australia
Mothers and babies - amendment
Previous data for the indicators below was incorrect and has subsequently been corrected in this release.
- Low birthweight babies, 2016 to 2018
- Women who reported smoking during a pregnancy, 2016 to 2018
- Antenatal visits below recommended level, 2016 to 2018
Fact sheets
Data release: Fact sheets: Emergency Department presentations for mental health-related conditions: variations by age group and socioeconomic disadvantage
This Fact sheet describes the age and socioeconomic background of people presenting to an Emergency Department for mental health-related conditions, drawing attention to differences in the extent to which these services are used by different population groups in the capital cities. More current data for South Australia shows the ongoing, and growing, impact to June 2021 on children and young people and the lower rate in the last year of presentations of people aged 65 years and over. Both of these trends point to concerns for the future health and wellbeing of the population.
Click here to access the fact sheet.
Data tools
Data release: Population pyramid tool
The population pyramid tool has been updated with the 2020 estimated resident population (ERP) for the whole population.
The Population pyramid generator allows you to generate population pyramids for the whole population for a range of geographical areas.
Click hereto access the tool.
Data release: 30 September 2021
Atlases
Data release: Topic-Specific Atlases - COVID-19 vaccination rates by Local Government Area - Time Series
The Australian Government Department of Health releases vaccination rates by Local Government Area each week.
View Variations in COVID-19 vaccination uptake over time, by Local Government Area.
Data release: Topic-Specific Atlases - Child and Youth Social Health Atlas of Australia
Age distribution - 5 year age groups
- Males, females, persons: 5 year age groups, estimated resident population (ERP), 2020
Age distribution - broad age groups
- Males, Females, Persons: broad age groups (ERP), 2020
Education
- Children aged 4 years old enrolled in a preschool program, 2020
- Children aged 5 years old enrolled in a preschool program, 2020
- Children aged 4 and 5 years old enrolled in a preschool program, 2020
Income support recipients
- Youth unemployment beneficiaries, June 2021
- Low income families (with children), June 2020
- Children in low income families, June 2020
Child and youth health
- Infant mortality, 2015 to 2019
- Youth mortality, 2015 to 2019
Potential years of life lost, males by age
- Potential years of life lost males, females, persons: broad age groups, 2015 to 2019
Admissions by sex and broad age group
- Male total admissions - Public hospitals, 2018/19
- Female total admissions - Public hospitals, 2018/19
- Total admissions - Public hospitals, 2018/19
Admissions by principal diagnosis and by broad age group
- Infectious and parasitic diseases - Public hospitals, 2018/19
- All cancers - Public hospitals, 2018/19
- Endocrine, nutritional and metabolic diseases - Public hospitals, 2018/19
- mental health-related conditions - Public hospitals, 2018/19
- Nervous system diseases - Public hospitals, 2018/19
- Ear and mastoid process diseases - Public hospitals, 2018/19
- Circulatory system diseases - Public hospitals, 2018/19
- Respiratory system diseases - Public hospitals, 2018/19
- Asthma - Public hospitals, 2018/19
- Digestive system diseases - Public hospitals, 2018/19
- Skin and subcutaneous tissue diseases - Public hospitals, 2018/19
- Musculoskeletal system and connective tissue diseases - Public hospitals, 2018/19
- Genitourinary system diseases - Public hospitals, 2018/19
- Congenital malformations, deformations and chromosomal abnormalities - Public hospitals, 2018/19
- Injury, poisoning and other external causes - Public hospitals, 2018/19
Admissions by principal diagnosis of injury or poisoning, by external cause and broad age group
- Transport crash Injury - Public hospitals, 2018/19
- Falls - Public hospitals, 2018/19
- Injury due to exposure to inanimate mechanical forces - Public hospitals, 2018/19
- All diagnosis of injury or poisoning, by external cause - Public hospitals, 2018/19
Admissions by procedure and broad age group
- Tonsillectomy - Public hospitals, 2018/19
- Myringotomy, 0 to 9 years - Public hospitals, 2018/19
Potentially preventable hospitalisations, by broad age group
- Potentially preventable conditions, aged 0 to 14 years - Public hospitals, 2018/19
- Potentially preventable conditions, aged 15 to 24 years - Public hospitals, 2018/19
Potentially preventable hospitalisations - Vaccine-preventable conditions, by broad age group
- Total vaccine-preventable conditions - Public hospitals, 2018/19
Potentially preventable hospitalisations - Acute conditions, by broad age group
- Acute convulsions and epilepsy - Public hospitals, 2018/19
- Acute dental conditions - Public hospitals, 2018/19
- Acute ear, nose and throat infections - Public hospitals, 2018/19
- Acute urinary tract infections, including pyelonephritis - Public hospitals, 2018/19
- Total acute conditions - Public hospitals, 2018/19
Potentially preventable hospitalisations - Chronic conditions, by broad age group
- Chronic asthma - Public hospitals, 2018/19
- Total chronic conditions - Public hospitals, 2018/19
Emergency department presentations, by age and sex
- Male presentations, by broad age group, 2018/19
- Female presentations, by broad age group, 2018/19
- Total presentations, by broad age group, 2018/19
Emergency department presentations, by triage category and broad age group
- Resuscitation presentations, 2018/19
- Emergency presentations, 2018/19
- Urgent presentations, 2018/19
- Semi-urgent presentations, 2018/19
- Non-urgent presentations, 2018/19
- Total presentations, 2018/19
Emergency department presentations, by principal diagnosis and broad age group
- Total presentations for certain infectious and parasitic diseases, 2018/19
- Total presentations for mental and behavioural disorders, 2018/19
- Total presentations for diseases of the circulatory system, 2018/19
- Total presentations for diseases of the respiratory system, 2018/19
- Total presentations for diseases of the digestive system, 2018/19
- Total presentations for diseases of the musculoskeletal system and connective tissue, 2018/19
- Total presentations for diseases of the genitourinary system, 2018/19
- Total presentations for injury, poisoning and certain other consequences of external causes, 2018/19
- Total presentations for factors influencing health status and contact with health services, 2018/19
Emergency department presentations for certain infectious and parasitic diseases, by age and sex
- Male presentations, by broad age group, 2018/19
- Female presentations, by broad age group, 2018/19
- Total presentations, by broad age group, 2018/19
Emergency department presentations for mental and behavioural disorders, by age and sex
- Male presentations, by broad age group, 2018/19
- Female presentations, by broad age group, 2018/19
- Total presentations, by broad age group, 2018/19
Emergency department presentations for diseases of the respiratory system, by age and sex
- Male presentations, by broad age group, 2018/19
- Female presentations, by broad age group, 2018/19
- Total presentations, by broad age group, 2018/19
Emergency department presentations for diseases of the digestive system, by age
- Total presentations, by broad age group, 2018/19
Emergency department presentations for diseases of the musculoskeletal system and connective tissue, by age
- Total presentations, by broad age group, 2018/19
Emergency department presentations for diseases of the genitourinary system, by age and sex
- Male presentations, by broad age group, 2018/19
- Female presentations, by broad age group, 2018/19
- Total presentations, by broad age group, 2018/19
Emergency department presentations for injury, poisoning and certain other consequences of external causes, by age and sex
- Male presentations, by broad age group, 2018/19
- Female presentations, by broad age group, 2018/19
- Total presentations, by broad age group, 2018/19
Emergency department presentations for factors influencing health status and contact with health services, by age
- Total presentations, by broad age group, 2018/19
Emergency department presentations for other diseases/ conditions, by age
- Total presentations, by broad age group, 2018/19
Click hereto access the maps for these atlases.
Click hereto access the graphs for these atlases.
Click hereto access the data for these atlases.
Data release: By Population Health Area, Local Government Area, Primary Health Network
Social Health Atlases of Australia
The topics and indicators in this latest release are listed below. Click the matrix table below to view the data and the format by which they are published.
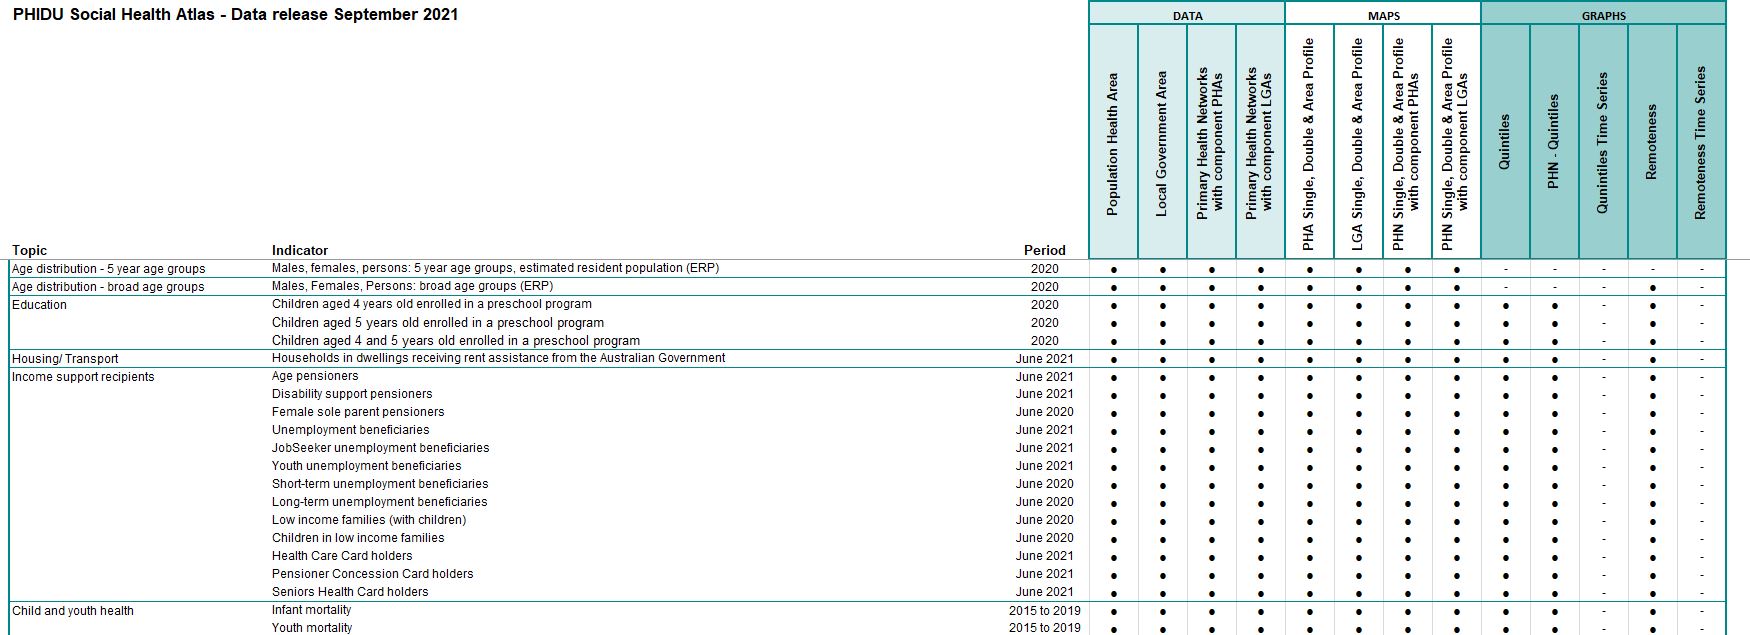
Age distribution - 5 year age groups
- Males, females, persons: 5 year age groups, estimated resident population (ERP), 2020
Age distribution - broad age groups
- Males, Females, Persons: broad age groups (ERP), 2020
Education
- Children aged 4 years old enrolled in a preschool program, 2020
- Children aged 5 years old enrolled in a preschool program, 2020
- Children aged 4 and 5 years old enrolled in a preschool program, 2020
Housing/ Transport
- Households in dwellings receiving rent assistance from the Australian Government, June 2021
Income support recipients
- Age pensioners, June 2021
- Disability support pensioners, June 2021
- Female sole parent pensioners, June 2020
- Unemployment beneficiaries, June 2021
- JobSeeker unemployment beneficiaries, June 2021
- Youth unemployment beneficiaries, June 2021
- Short-term unemployment beneficiaries, June 2020
- Long-term unemployment beneficiaries, June 2020
- Low income families (with children), June 2020
- Children in low income families, June 2020
- Health Care Card holders, June 2021
- Pensioner Concession Card holders, June 2021
- Seniors Health Card holders, June 2021
Child and youth health
- Infant mortality, 2015 to 2019
- Youth mortality, 2015 to 2019
Median age at death by sex
- Median age at death of males, females, persons, 2015 to 2019
Premature mortality by sex
- Deaths of males, females, persons aged 0 to 74 years, 2015 to 2019
Premature mortality by selected cause
- Deaths from cancer, persons aged 0 to 74 years, 2015 to 2019
- Deaths from colorectal cancer, persons aged 0 to 74 years, 2015 to 2019
- Deaths from lung cancer, persons aged 0 to 74 years, 2015 to 2019
- Deaths from breast cancer, persons aged 0 to 74 years, 2015 to 2019
- Deaths from endocrine, nutritional and metabolic diseases - deaths from diabetes, 0 to 74 years, 2015 to 2019
- Deaths from circulatory system diseases aged 0 to 74 years, 2015 to 2019
- Deaths from ischaemic heart disease, persons aged 0 to 74 years, 2015 to 2019
- Deaths from cerebrovascular diseases, persons aged 0 to 74 years, 2015 to 2019
- Deaths from respiratory system diseases aged 0 to 74 years, 2015 to 2019
- Deaths from chronic obstructive pulmonary disease (COPD) aged 0 to 74 years, 2015 to 2019
- Deaths from external causes aged 0 to 74 years, 2015 to 2019
- Deaths from road traffic injuries, persons aged 0 to 74 years, 2015 to 2019
- Deaths from suicide and self-inflicted injuries, persons aged 0 to 74 years, 2015 to 2019
Avoidable mortality by sex
- Deaths from all avoidable causes, males, females, persons aged 0 to 74 years, 2015 to 2019
Avoidable mortality by selected cause
- Avoidable deaths from cancer, persons aged 0 to 74 years, 2015 to 2019
- Avoidable deaths from colorectal cancer, persons aged 0 to 74 years, 2015 to 2019
- Avoidable deaths from breast cancer, persons aged 0 to 74 years, 2015 to 2019
- Avoidable deaths from diabetes aged 0 to 74 years, 2015 to 2019
- Avoidable deaths from circulatory system diseases aged 0 to 74 years, 2015 to 2019
- Avoidable deaths from ischaemic heart disease, persons aged 0 to 74 years, 2015 to 2019
- Avoidable deaths from cerebrovascular diseases, persons aged 0 to 74 years, 2015 to 2019
- Avoidable deaths from respiratory system diseases aged 0 to 74 years, 2015 to 2019
- Avoidable deaths from chronic obstructive pulmonary disease (COPD), persons aged 0 to 74 years, 2015 to 2019
- Avoidable deaths from selected external causes of mortality aged 0 to 74 years, 2015 to 2019
- Avoidable deaths from suicide and self-inflicted injuries, persons aged 0 to 74 years, 2015 to 2019
- Avoidable deaths from other external causes of mortality aged 0 to 74 years, persons aged 0 to 74 years, 2015 to 2019
- Avoidable deaths from transport accidents, persons aged 0 to 74 years, 2015 to 2019
Potential years of life lost by sex
- Potential years of life lost males, females, persons, 2015 to 2019
Potential years of life lost by sex and age
- Potential years of life lost males, females, persons: broad age groups, 2015 to 2019
Potential years of life lost by selected cause
- Potential years of life lost from cancer, 2015 to 2019
- Potential years of life lost from colorectal cancer, 2015 to 2019
- Potential years of life lost from lung cancer, 2015 to 2019
- Potential years of life lost from breast cancer, 2015 to 2019
- Potential years of life lost from diabetes, 2015 to 2019
- Potential years of life lost from circulatory system diseases, 2015 to 2019
- Potential years of life lost from ischaemic heart disease, 2015 to 2019
- Potential years of life lost from cerebrovascular diseases, 2015 to 2019
- Potential years of life lost from respiratory system diseases, 2015 to 2019
- Potential years of life lost from chronic obstructive pulmonary disease (COPD), 2015 to 2019
- Potential years of life lost from external causes, 2015 to 2019
- Potential years of life lost from road traffic injuries, 2015 to 2019
- Potential years of life lost from suicide and self-inflicted injuries, 2015 to 2019
Aged Care
- Residential Aged Care Places, 30 June 2020
Data release: By quintile of socioeconomic disadvantage of area (including within Primary Health Networks) and Remoteness Area
Social Health Atlases of Australia
The topics and indicators in this latest release are listed below. Click the matrix table below to view the data and the format by which they are published.
Age distribution - broad age groups (Remoteness only)
- Males, Females, Persons: broad age groups (ERP), 2020
Education
- Children aged 4 years old enrolled in a preschool program, 2020
- Children aged 5 years old enrolled in a preschool program, 2020
- Children aged 4 and 5 years old enrolled in a preschool program, 2020
Housing/ Transport
- Households in dwellings receiving rent assistance from the Australian Government, June 2021
Income support recipients
- Age pensioners, June 2021
- Disability support pensioners, June 2021
- Female sole parent pensioners, June 2020
- Unemployment beneficiaries, June 2021
- JobSeeker unemployment beneficiaries, June 2021
- Youth unemployment beneficiaries, June 2021
- Short-term unemployment beneficiaries, June 2020
- Long-term unemployment beneficiaries, June 2020
- Low income families (with children), June 2020
- Children in low income families, June 2020
- Health Care Card holders, June 2021
- Pensioner Concession Card holders, June 2021
- Seniors Health Card holders, June 2021
Child and youth health
- Infant mortality, 2015 to 2019
- Youth mortality, 2015 to 2019
Median age at death by sex
- Median age at death of males, females, persons, 2015 to 2019
Premature mortality by sex
- Deaths of males, females, persons aged 0 to 74 years, 2015 to 2019
Premature mortality by selected cause
- Deaths from cancer, persons aged 0 to 74 years, 2015 to 2019
- Deaths from colorectal cancer, persons aged 0 to 74 years, 2015 to 2019
- Deaths from lung cancer, persons aged 0 to 74 years, 2015 to 2019
- Deaths from breast cancer, persons aged 0 to 74 years, 2015 to 2019
- Deaths from endocrine, nutritional and metabolic diseases - deaths from diabetes, 0 to 74 years, 2015 to 2019
- Deaths from circulatory system diseases aged 0 to 74 years, 2015 to 2019
- Deaths from ischaemic heart disease, persons aged 0 to 74 years, 2015 to 2019
- Deaths from cerebrovascular diseases, persons aged 0 to 74 years, 2015 to 2019
- Deaths from respiratory system diseases aged 0 to 74 years, 2015 to 2019
- Deaths from chronic obstructive pulmonary disease (COPD) aged 0 to 74 years, 2015 to 2019
- Deaths from external causes aged 0 to 74 years, 2015 to 2019
- Deaths from road traffic injuries, persons aged 0 to 74 years, 2015 to 2019
- Deaths from suicide and self-inflicted injuries, persons aged 0 to 74 years, 2015 to 2019
Avoidable mortality by sex
- Deaths from all avoidable causes, males, females, persons aged 0 to 74 years, 2015 to 2019
Avoidable mortality by selected cause
- Avoidable deaths from cancer, persons aged 0 to 74 years, 2015 to 2019
- Avoidable deaths from colorectal cancer, persons aged 0 to 74 years, 2015 to 2019
- Avoidable deaths from breast cancer, persons aged 0 to 74 years, 2015 to 2019
- Avoidable deaths from diabetes aged 0 to 74 years, 2015 to 2019
- Avoidable deaths from circulatory system diseases aged 0 to 74 years, 2015 to 2019
- Avoidable deaths from ischaemic heart disease, persons aged 0 to 74 years, 2015 to 2019
- Avoidable deaths from cerebrovascular diseases, persons aged 0 to 74 years, 2015 to 2019
- Avoidable deaths from respiratory system diseases aged 0 to 74 years, 2015 to 2019
- Avoidable deaths from chronic obstructive pulmonary disease (COPD), persons aged 0 to 74 years, 2015 to 2019
- Avoidable deaths from selected external causes of mortality aged 0 to 74 years, 2015 to 2019
- Avoidable deaths from suicide and self-inflicted injuries, persons aged 0 to 74 years, 2015 to 2019
- Avoidable deaths from other external causes of mortality aged 0 to 74 years, persons aged 0 to 74 years, 2015 to 2019
- Avoidable deaths from transport accidents, persons aged 0 to 74 years, 2015 to 2019
Potential years of life lost by sex
- Potential years of life lost males, females, persons, 2015 to 2019
Potential years of life lost, by sex and age
- Potential years of life lost males, females, persons: broad age groups, 2015 to 2019
Potential years of life lost by selected cause
- Potential years of life lost from cancer, 2015 to 2019
- Potential years of life lost from colorectal cancer, 2015 to 2019
- Potential years of life lost from lung cancer, 2015 to 2019
- Potential years of life lost from breast cancer, 2015 to 2019
- Potential years of life lost from diabetes, 2015 to 2019
- Potential years of life lost from circulatory system diseases, 2015 to 2019
- Potential years of life lost from ischaemic heart disease, 2015 to 2019
- Potential years of life lost from cerebrovascular diseases, 2015 to 2019
- Potential years of life lost from respiratory system diseases, 2015 to 2019
- Potential years of life lost from chronic obstructive pulmonary disease (COPD), 2015 to 2019
- Potential years of life lost from external causes, 2015 to 2019
- Potential years of life lost from road traffic injuries, 2015 to 2019
- Potential years of life lost from suicide and self-inflicted injuries, 2015 to 2019
Aged Care
- Residential Aged Care Places, 30 June 2020
Fact sheets
Data release: Fact sheets - Variation in potentially preventable hospitalisation rates for Aboriginal and Torres Strait Islander people are geographically persistent over time across Australian states and territories
Hospitalisations for a condition where an admission to hospital could have potentially been prevented through the provision of an appropriate individualised preventative health intervention and early disease management, usually delivered in primary care and community-based care settings are a burden on the Australian hospital system. This fact sheet provides an overview of a geographic analysis of the variation in rates of these types of hospitalisations for Aboriginal and Torres Strait Islander people seeking to know how consistent they are over time across Australian states and territories.
Click here to access the fact sheet.
Data release: 20 September 2021
Data release: Topic-Specific Atlases - COVID-19 vaccinations by LGA show the successes, hide the challenges to come
Dr Kerry Chant, Chief Health Officer, NSW Health said there needs to be a "strong equity focus" in order to achieve the 90 per cent target. The extent of the challenge to achieve a high vaccination rate across all population groups is highlighted by the variations between LGAs across Greater Sydney and Regional New South Wales. However, of greater concern are the marked variations within many LGAs, pointing to the need to have a strong population health focus if equity in vaccination and returning to a more open way of life is to be achieved.
Click hereto access the Atlas.
Data release: 10 September 2021
Data release: Topic-Specific Atlases - COVID-19 vaccination rates by Local Government Area (whole population) and Regional areas (Aboriginal and Torres Strait Islander people and whole population)
The Australian Government Department of Health releases vaccination rates by Local Government Area each week. This atlas will be updated at the beginning of each month to show the latest coverage at the Local Government Area level. The atlas includes a selection of demographic and socioeconomic status indicators from the Social Health Atlas of Australia. In addition, the age-standardised rate of vaccinations per 100 population has been added, providing a better comparison of vaccination uptake between Local Government Areas with differing age structures.
View Variations in COVID-19 vaccination uptake, by Local Government Area.
Concerns have been raised about the low rates of vaccination in Aboriginal communities; these low rates are evident in regional data for Aboriginal and Torres Strait Islander people first released by the Australian Government Department of Health on 1 September 2021 and now included in this atlas, together with a selection of demographic and socioeconomic status indicators from the Social Health Atlas of Australia.
Data release: 12 August 2021
Data release: Topic-Specific Atlases - Indigenous Status Comparison Social Health Atlas of Australia
Admissions by sex (excluding same-day admissions for renal dialysis)
- Male, female, and total Indigenous/ Non-Indigenous admissions, 2017/18 to 2018/19
Admissions by age (excluding same-day admissions for renal dialysis)
- Total admissions, Indigenous/ Non-Indigenous persons aged 0 to 14, 15 to 24, 25 to 44, 45 to 64, and 65 years and over, 2017/18 to 2018/19
Admissions by selected principal diagnosis
- Infectious and parasitic diseases, Indigenous/ Non-Indigenous persons, 2017/18 to 2018/19
- All cancers, Indigenous/ Non-Indigenous persons, 2017/18 to 2018/19
- Endocrine, nutritional and metabolic diseases, Indigenous/ Non-Indigenous persons, 2017/18 to 2018/19
- - Diabetes, Indigenous/ Non-Indigenous persons, 2017/18 to 2018/19
- mental health-related conditions, Indigenous/ Non-Indigenous persons, 2017/18 to 2018/19
- - Mood affective disorders, Indigenous/ Non-Indigenous persons, 2017/18 to 2018/19
- Nervous system diseases, Indigenous/ Non-Indigenous persons, 2017/18 to 2018/19
- Eye and adnexa diseases, Indigenous/ Non-Indigenous persons, 2017/18 to 2018/19
- Ear and mastoid process diseases, Indigenous/ Non-Indigenous persons, 2017/18 to 2018/19
- Circulatory system diseases, Indigenous/ Non-Indigenous persons, 2017/18 to 2018/19
- - Ischaemic heart disease, Indigenous/ Non-Indigenous persons, 2017/18 to 2018/19
- - Heart failure, Indigenous/ Non-Indigenous persons, 2017/18 to 2018/19
- Respiratory system diseases, Indigenous/ Non-Indigenous persons, 2017/18 to 2018/19
- - Asthma, Indigenous/ Non-Indigenous persons, 2017/18 to 2018/19
- - Chronic obstructive pulmonary disease (COPD), Indigenous/ Non-Indigenous persons, 2017/18 to 2018/19
- Digestive system diseases, Indigenous/ Non-Indigenous persons, 2017/18 to 2018/19
- Skin and subcutaneous tissue diseases, Indigenous/ Non-Indigenous persons, 2017/18 to 2018/19
- Musculoskeletal system and connective tissue diseases, Indigenous/ Non-Indigenous persons, 2017/18 to 2018/19
- Genitourinary system diseases, Indigenous/ Non-Indigenous persons, 2017/18 to 2018/19
- - Chronic kidney disease, Indigenous/ Non-Indigenous persons, 2017/18 to 2018/19
- Pregnancy, childbirth and the puerperium, Indigenous/ Non-Indigenous females aged 15 to 44 years, 2017/18 to 2018/19
- Congenital malformations, deformations and chromosomal abnormalities, Indigenous/ Non-Indigenous persons, 2017/18 to 2018/19
- Injury, poisoning and other external causes, Indigenous/ Non-Indigenous persons, 2017/18 to 2018/19
Admissions by selected principal diagnosis and age
- Infectious and parasitic diseases, Indigenous/ Non-Indigenous persons aged 0 to 14 years, and 15 years and over, 2017/18 to 2018/19
- Respiratory system diseases, Indigenous/ Non-Indigenous persons aged 0 to 14 years, and 15 years and over, 2017/18 to 2018/19
- Digestive system diseases, Indigenous/ Non-Indigenous persons aged 0 to 14 years, and 15 years and over, 2017/18 to 2018/19
- Skin and subcutaneous tissue diseases, Indigenous/ Non-Indigenous persons aged 0 to 14 years, and 15 years and over, 2017/18 to 2018/19
- Injury, poisoning and other external causes, Indigenous/ Non-Indigenous persons aged 0 to 14 years, and 15 years and over, 2017/18 to 2018/19
Admissions by principal diagnosis of injury or poisoning, by external cause
- Transport crash injury, Indigenous/ Non-Indigenous persons, 2017/18 to 2018/19
- Falls, Indigenous/ Non-Indigenous persons, 2017/18 to 2018/19
- Injury due to exposure to inanimate mechanical forces, Indigenous/ Non-Indigenous persons, 2017/18 to 2018/19
- Injury due to exposure to animate mechanical forces, Indigenous/ Non-Indigenous persons, 2017/18 to 2018/19
- Intentional self-harm, Indigenous/ Non-Indigenous persons, 2017/18 to 2018/19
- Assault, Indigenous/ Non-Indigenous persons, 2017/18 to 2018/19
- Total diagnosis of injury or poisoning, by external cause, Indigenous/ Non-Indigenous persons, 2017/18 to 2018/19
Same-day admissions for renal dialysis
- Same-day admissions for dialysis for kidney disease, Indigenous/ Non-Indigenous persons, 2017/18 to 2018/19
Potentially preventable hospitalisations
- Potentially preventable conditions, Indigenous/ Non-Indigenous persons, 2017/18 to 2018/19
Potentially preventable hospitalisations by age
- Potentially preventable conditions, Indigenous/ Non-Indigenous persons aged 0 to 14, 15 to 24, 25 to 44, 45 to 64, and 65 years and over, 2017/18 to 2018/19
Potentially preventable hospitalisations - Vaccine-preventable conditions
- Vaccine-preventable conditions - pneumonia and influenza, Indigenous/ Non-Indigenous persons, 2017/18 to 2018/19
- Total Vaccine-preventable conditions, Indigenous/ Non-Indigenous persons, 2017/18 to 2018/19
Potentially preventable hospitalisations - Acute conditions
- Acute cellulitis, Indigenous/ Non-Indigenous persons, 2017/18 to 2018/19
- Acute convulsions and epilepsy, Indigenous/ Non-Indigenous persons, 2017/18 to 2018/19
- Acute dental conditions, Indigenous/ Non-Indigenous persons, 2017/18 to 2018/19
- Acute ear, nose and throat infections, Indigenous/ Non-Indigenous persons, 2017/18 to 2018/19
- Acute urinary tract infections, including pyelonephritis, Indigenous/ Non-Indigenous persons, 2017/18 to 2018/19
- Total acute conditions, Indigenous/ Non-Indigenous persons, 2017/18 to 2018/19
Potentially preventable hospitalisations - Chronic conditions
- Chronic angina, Indigenous/ Non-Indigenous persons, 2017/18 to 2018/19
- Chronic asthma, Indigenous/ Non-Indigenous persons, 2017/18 to 2018/19
- Chronic congestive cardiac failure, Indigenous/ Non-Indigenous persons, 2017/18 to 2018/19
- Chronic obstructive pulmonary disease (COPD), Indigenous/ Non-Indigenous persons, 2017/18 to 2018/19
- Chronic diabetes complications, Indigenous/ Non-Indigenous persons, 2017/18 to 2018/19
- Chronic iron deficiency anaemia, Indigenous/ Non-Indigenous persons, 2017/18 to 2018/19
- Total chronic conditions, Indigenous/ Non-Indigenous persons, 2017/18 to 2018/19
Emergency department presentations, by triage category
- Resuscitation and emergency presentations, Indigenous/ Non-Indigenous persons, 2018/19
- Urgent presentations, Indigenous/ Non-Indigenous persons, 2018/19
- Semi-urgent presentations, Indigenous/ Non-Indigenous persons, 2018/19
- Non-urgent presentations, Indigenous/ Non-Indigenous persons, 2018/19
- Total presentations, Indigenous/ Non-Indigenous persons, 2018/19
Emergency department presentations, by principal diagnosis
- Total presentations for certain infectious and parasitic diseases, Indigenous/ Non-Indigenous persons, 2018/19
- Total presentations for mental and behavioural disorders, Indigenous/ Non-Indigenous persons, 2018/19
- Total presentations for diseases of the circulatory system, Indigenous/ Non-Indigenous persons, 2018/19
- Total presentations for diseases of the respiratory system, Indigenous/ Non-Indigenous persons, 2018/19
- Total presentations for diseases of the digestive system, Indigenous/ Non-Indigenous persons, 2018/19
- Total presentations for diseases of the musculoskeletal system and connective tissue, Indigenous/ Non-Indigenous persons, 2018/19
- Total presentations for diseases of the genitourinary system, 2018/19
- Total presentations for injury, poisoning and certain other consequences of external causes, Indigenous/ Non-Indigenous persons, 2018/19
- Total presentations for factors influencing health status and contact with health services, Indigenous/ Non-Indigenous persons, 2018/19
- Total presentations, Indigenous/ Non-Indigenous persons, 2018/19
Emergency department presentations - resuscitation and emergency, by principal diagnosis
- Resuscitation and emergency presentations for diseases of the respiratory system, Indigenous/ Non-Indigenous persons, 2018/19
- Resuscitation and emergency presentations for injury, poisoning and certain other consequences of external causes, Indigenous/ Non-Indigenous persons, 2018/19
- Total resuscitation and emergency presentations, Indigenous/ Non-Indigenous persons, 2018/19
Emergency department presentations – urgent, by principal diagnosis
- Urgent presentations for diseases of the respiratory system, Indigenous/ Non-Indigenous persons, 2018/19
- Urgent presentations for injury, poisoning and certain other consequences of external causes, Indigenous/ Non-Indigenous persons, 2018/19
- Total urgent presentations, Indigenous/ Non-Indigenous persons, 2018/19
Emergency department presentations - resuscitation, emergency and urgent, by principal diagnosis
- Resuscitation, emergency and urgent presentations for certain infectious and parasitic diseases, Indigenous/ Non-Indigenous persons, 2018/19
- Resuscitation, emergency and urgent presentations for mental and behavioural disorders, Indigenous/ Non-Indigenous persons, 2018/19
- Resuscitation, emergency and urgent presentations for diseases of the respiratory system, Indigenous/ Non-Indigenous persons, 2018/19
- Resuscitation, emergency and urgent presentations for diseases of the digestive system, Indigenous/ Non-Indigenous persons, 2018/19
- Resuscitation, emergency and urgent presentations for diseases of the musculoskeletal system and connective tissue, Indigenous/ Non-Indigenous persons, 2018/19
- Resuscitation, emergency and urgent presentations for diseases of the genitourinary system, Indigenous/ Non-Indigenous persons, 2018/19
- Resuscitation, emergency and urgent presentations for factors influencing health status and contact with health services, Indigenous/ Non-Indigenous persons, 2018/19
- Total resuscitation, emergency and urgent presentations, Indigenous/ Non-Indigenous persons, 2018/19
Emergency department presentations - semi-urgent, by principal diagnosis
- Semi-urgent presentations for injury, poisoning and certain other consequences of external causes, Indigenous/ Non-Indigenous persons, 2018/19
- Semi-urgent presentations for factors influencing health status and contact with health services, Indigenous/ Non-Indigenous persons, 2018/19
- Total semi-urgent presentations, Indigenous/ Non-Indigenous persons, 2018/19
Emergency department presentations - non-urgent, by principal diagnosis
- Non-urgent presentations for injury, poisoning and certain other consequences of external causes, Indigenous/ Non-Indigenous persons, 2018/19
- Non-urgent presentations for factors influencing health status and contact with health services, Indigenous/ Non-Indigenous persons, 2018/19
- Total non-urgent presentations, Indigenous/ Non-Indigenous persons, 2018/19
Emergency department presentations - semi-urgent and non-urgent, by principal diagnosis
- Semi-urgent and non-urgent presentations for certain infectious and parasitic diseases, Indigenous/ Non-Indigenous persons, 2018/19
- Semi-urgent and non-urgent presentations for mental and behavioural disorders, Indigenous/ Non-Indigenous persons, 2018/19
- Semi-urgent and non-urgent presentations for diseases of the respiratory system, Indigenous/ Non-Indigenous persons, 2018/19
- Semi-urgent and non-urgent presentations for diseases of the digestive system, Indigenous/ Non-Indigenous persons, 2018/19
- Semi-urgent and non-urgent presentations for diseases of the musculoskeletal system and connective tissue, Indigenous/ Non-Indigenous persons, 2018/19
- Semi-urgent and non-urgent presentations for diseases of the genitourinary system, 2018/19
- Total semi-urgent and non-urgent presentations, Indigenous/ Non-Indigenous persons, 2018/19
Data release: 31 July 2021
Atlases
Data release: By Indigenous Area, Primary Health Networks, quintile of Indigenous Relative Socioeconomic Outcomes and Remoteness Areas
Aboriginal & Torres Strait Islander Social Health Atlases of Australia
The topics and indicators in this latest release are listed below. Click the matrix table below to view the data and the format by which they are published.
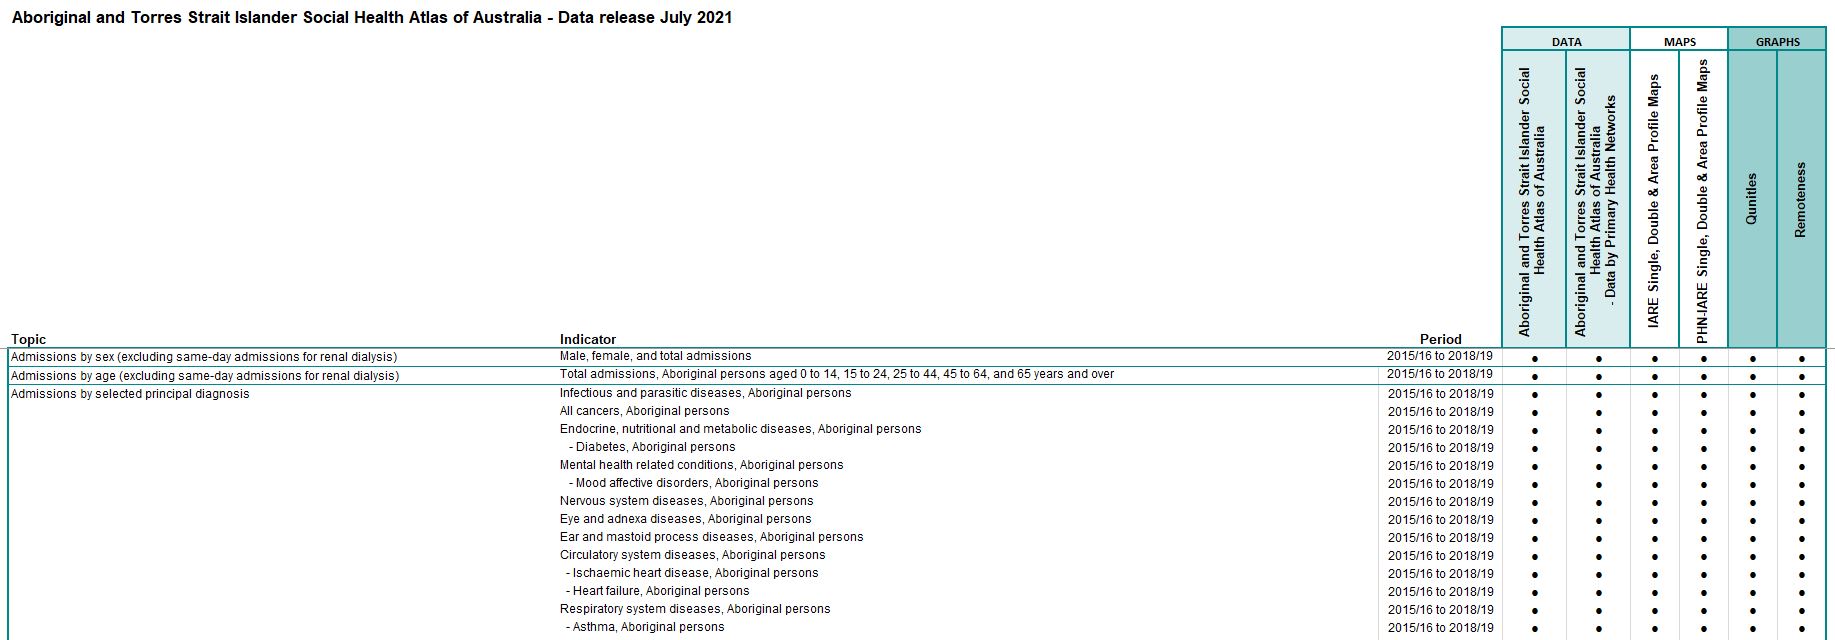
Admissions by sex (excluding same-day admissions for renal dialysis)
- Male, female, and total admissions, 2016/17 to 2018/19
Admissions by age (excluding same-day admissions for renal dialysis)
- Total admissions, Aboriginal persons aged 0 to 14, 15 to 24, 25 to 44, 45 to 64, and 65 years and over, 2016/17 to 2018/19
Admissions by selected principal diagnosis
- Infectious and parasitic diseases, Aboriginal persons, 2016/17 to 2018/19
- All cancers, Aboriginal persons, 2016/17 to 2018/19
- Endocrine, nutritional and metabolic diseases, Aboriginal persons, 2016/17 to 2018/19
- - Diabetes, Aboriginal persons, 2016/17 to 2018/19
- mental health-related conditions, Aboriginal persons, 2016/17 to 2018/19
- - Mood affective disorders, Aboriginal persons, 2016/17 to 2018/19
- Nervous system diseases, Aboriginal persons, 2016/17 to 2018/19
- Eye and adnexa diseases, Aboriginal persons, 2016/17 to 2018/19
- Ear and mastoid process diseases, Aboriginal persons, 2016/17 to 2018/19
- Circulatory system diseases, Aboriginal persons, 2016/17 to 2018/19
- - Ischaemic heart disease, Aboriginal persons, 2016/17 to 2018/19
- - Heart failure, Aboriginal persons, 2016/17 to 2018/19
- Respiratory system diseases, Aboriginal persons, 2016/17 to 2018/19
- - Asthma, Aboriginal persons, 2016/17 to 2018/19
- - Chronic obstructive pulmonary disease (COPD), Aboriginal persons, 2016/17 to 2018/19
- Digestive system diseases, Aboriginal persons, 2016/17 to 2018/19
- Skin and subcutaneous tissue diseases, Aboriginal persons, 2016/17 to 2018/19
- Musculoskeletal system and connective tissue diseases, Aboriginal persons, 2016/17 to 2018/19
- Genitourinary system diseases, Aboriginal persons, 2016/17 to 2018/19
- - Chronic kidney disease, Aboriginal persons, 2016/17 to 2018/19
- Pregnancy, childbirth and the puerperium, Aboriginal females aged 15 to 44 years, 2016/17 to 2018/19
- Congenital malformations, deformations and chromosomal abnormalities, Aboriginal persons, 2016/17 to 2018/19
- Injury, poisoning and other external causes, Aboriginal persons, 2016/17 to 2018/19
Admissions by selected principal diagnosis and age
- Infectious and parasitic diseases, Aboriginal persons aged 0 to 14 years, and 15 years and over, 2016/17 to 2018/19
- Respiratory system diseases, Aboriginal persons aged 0 to 14 years, and 15 years and over, 2016/17 to 2018/19
- Digestive system diseases, Aboriginal persons aged 0 to 14 years, and 15 years and over, 2016/17 to 2018/19
- Skin and subcutaneous tissue diseases, Aboriginal persons aged 0 to 14 years, and 15 years and over, 2016/17 to 2018/19
- Injury, poisoning and other external causes, Aboriginal persons aged 0 to 14 years, and 15 years and over, 2016/17 to 2018/19
Admissions by principal diagnosis of injury or poisoning, by external cause
- Transport crash injury, Aboriginal persons, 2016/17 to 2018/19
- Falls, Aboriginal persons, 2016/17 to 2018/19
- Injury due to exposure to inanimate mechanical forces, Aboriginal persons, 2016/17 to 2018/19
- Injury due to exposure to animate mechanical forces, Aboriginal persons, 2016/17 to 2018/19
- Intentional self-harm, Aboriginal persons, 2016/17 to 2018/19
- Assault, Aboriginal persons, 2016/17 to 2018/19
- Total diagnosis of injury or poisoning, by external cause, Aboriginal persons, 2016/17 to 2018/19
Same-day admissions for renal dialysis
- Same-day admissions for dialysis for kidney disease, Aboriginal persons, 2016/17 to 2018/19
Potentially preventable hospitalisations
- Potentially preventable conditions, Aboriginal persons, 2016/17 to 2018/19
Potentially preventable hospitalisations by age
- Potentially preventable conditions, Aboriginal persons aged 0 to 14, 15 to 24, 25 to 44, 45 to 64, and 65 years and over, 2016/17 to 2018/19
Potentially preventable hospitalisations - Vaccine-preventable conditions
- Vaccine-preventable conditions - pneumonia and influenza, Aboriginal persons, 2016/17 to 2018/19
- Total Vaccine-preventable conditions, Aboriginal persons, 2016/17 to 2018/19
Potentially preventable hospitalisations - Acute conditions
- Acute cellulitis, Aboriginal persons, 2016/17 to 2018/19
- Acute convulsions and epilepsy, Aboriginal persons, 2016/17 to 2018/19
- Acute dental conditions, Aboriginal persons, 2016/17 to 2018/19
- Acute ear, nose and throat infections, Aboriginal persons, 2016/17 to 2018/19
- Acute urinary tract infections, including pyelonephritis, Aboriginal persons, 2016/17 to 2018/19
- Total acute conditions, Aboriginal persons, 2016/17 to 2018/19
Potentially preventable hospitalisations - Chronic conditions
- Chronic angina, Aboriginal persons, 2016/17 to 2018/19
- Chronic asthma, Aboriginal persons, 2016/17 to 2018/19
- Chronic congestive cardiac failure, Aboriginal persons, 2016/17 to 2018/19
- Chronic obstructive pulmonary disease (COPD), Aboriginal persons, 2016/17 to 2018/19
- Chronic diabetes complications, Aboriginal persons, 2016/17 to 2018/19
- Chronic iron deficiency anaemia, Aboriginal persons, 2016/17 to 2018/19
- Total chronic conditions, Aboriginal persons, 2016/17 to 2018/19
Emergency department presentations, total - by triage category
- Total presentations, Aboriginal persons, 2018/19
- Resuscitation and emergency presentations - Total, Aboriginal persons, 2018/19
- Urgent presentations - Total, Aboriginal persons, 2018/19
- Semi-urgent presentations - Total, Aboriginal persons, 2018/19
- Non-urgent presentations - Total, Aboriginal persons, 2018/19
Emergency department presentations, total - by principal diagnosis
- Total presentations, Aboriginal persons, 2018/19
- Total presentations for certain infectious and parasitic diseases, Aboriginal persons, 2018/19
- Total presentations for mental and behavioural disorders, Aboriginal persons, 2018/19
- Total presentations for diseases of the circulatory system, Aboriginal persons, 2018/19
- Total presentations for diseases of the respiratory system, Aboriginal persons, 2018/19
- Total presentations for diseases of the digestive system, Aboriginal persons, 2018/19
- Total presentations for diseases of the musculoskeletal system and connective tissue, Aboriginal persons, 2018/19
- Total presentations for diseases of the genitourinary system, 2018/19
- Total presentations for injury, poisoning and certain other consequences of external causes, Aboriginal persons, 2018/19
- Total presentations for factors influencing health status and contact with health services, Aboriginal persons, 2018/19
Emergency department presentations, resuscitation and emergency - by principal diagnosis
- Resuscitation and emergency presentations - Total, Aboriginal persons, 2018/19
- Resuscitation and emergency presentations for diseases of the respiratory system, Aboriginal persons, 2018/19
- Resuscitation and emergency presentations for injury, poisoning and certain other consequences of external causes, Aboriginal persons, 2018/19
Emergency department presentations, urgent - by principal diagnosis
- Urgent presentations - Total, Aboriginal persons, 2018/19
- Urgent presentations for diseases of the respiratory system, Aboriginal persons, 2018/19
- Urgent presentations for injury, poisoning and certain other consequences of external causes, Aboriginal persons, 2018/19
Emergency department presentations, resuscitation, emergency and urgent - by principal diagnosis
- Resuscitation, emergency and urgent presentations - Total, Aboriginal persons, 2018/19
- Resuscitation, emergency and urgent presentations for certain infectious and parasitic diseases, Aboriginal persons, 2018/19
- Resuscitation, emergency and urgent presentations for mental and behavioural disorders, Aboriginal persons, 2018/19
- Resuscitation, emergency and urgent presentations for diseases of the respiratory system, Aboriginal persons, 2018/19
- Resuscitation, emergency and urgent presentations for diseases of the digestive system, Aboriginal persons, 2018/19
- Resuscitation, emergency and urgent presentations for diseases of the musculoskeletal system and connective tissue, Aboriginal persons, 2018/19
- Resuscitation, emergency and urgent presentations for diseases of the genitourinary system, Aboriginal persons, 2018/19
- Resuscitation, emergency and urgent presentations for factors influencing health status and contact with health services, Aboriginal persons, 2018/19
Emergency department presentations, semi-urgent - by principal diagnosis
- Semi-urgent presentations - Total, Aboriginal persons, 2018/19
- Semi-urgent presentations for injury, poisoning and certain other consequences of external causes, Aboriginal persons, 2018/19
- Semi-urgent presentations for factors influencing health status and contact with health services, Aboriginal persons, 2018/19
Emergency department presentations, non-urgent - by principal diagnosis
- Non-urgent presentations - Total, Aboriginal persons, 2018/19
- Non-urgent presentations for injury, poisoning and certain other consequences of external causes, Aboriginal persons, 2018/19
- Non-urgent presentations for factors influencing health status and contact with health services, Aboriginal persons, 2018/19
Emergency department presentations, semi-urgent and non-urgent - by principal diagnosis
- Semi-urgent and non-urgent presentations - Total, Aboriginal persons, 2018/19
- Semi-urgent and non-urgent presentations for certain infectious and parasitic diseases, Aboriginal persons, 2018/19
- Semi-urgent and non-urgent presentations for mental and behavioural disorders, Aboriginal persons, 2018/19
- Semi-urgent and non-urgent presentations for diseases of the respiratory system, Aboriginal persons, 2018/19
- Semi-urgent and non-urgent presentations for diseases of the digestive system, Aboriginal persons, 2018/19
- Semi-urgent and non-urgent presentations for diseases of the musculoskeletal system and connective tissue, Aboriginal persons, 2018/19
- Semi-urgent and non-urgent presentations for diseases of the genitourinary system, 2018/19
Fact sheets
Data release: Fact sheets - Cancer
There were over 600,000 cases of cancer (excluding basal cell carcinoma and squamous cell carcinoma) reported in Australia from 2010 to 2014. The socioeconomic distribution of cancer varies greatly by cancer type. However, the impact of cancer through premature mortality follows a strong socioeconomic gradient regardless of type of cancer.
Click hereto access the fact sheet.
Data release: Fact sheets - Producing time-series estimated resident populations by Indigenous Area for Aboriginal and Torres Strait Islander people
This fact sheet describes the process used to prepare populations for Aboriginal and Torres Strait Islander (referred to as Indigenous) people by Indigenous Area (IARE) and age group over the years 2001 to 2016. These populations were used to prepare the rates for Indigenous (and Non-Indigenous) deaths published as revised rates in the Closing the gap Time Series Atlas.
Click hereto access the fact sheet.
Data release: Fact sheets - Variation in the rates of potentially preventable hospitalisations are geographically consistent over time across Australian states and territories.
Hospitalisations for a condition where an admission to hospital could have potentially been prevented through the provision of an appropriate individualised preventative health intervention and early disease management, usually delivered in primary care and community-based care settings are a burden on the Australian hospital system. We provide a geographic analysis of the variation in rates of these types of hospitalisations seeking to know how consistent they are over time across Australian states and territories.
Click hereto access the fact sheet.
Data release: 28 June 2021
Topic-Specific Atlases - Causes of premature and potentially avoidable death; identifying hotspots of inequality - a Geographic and Temporal Analysis
The number of deaths in general and by specific cause are indicators of a population’s health and safety. As a population health measure, areas with consistently higher death rates demonstrate areas of inequality and this phenomenon can be deeply entrenched over time. The availability of a long-term archive of death records and the consistent recording of the residential location within these files has meant that the degree of geographic and temporal variation in the causes of death can now be examined at the small area level across Australia.
Click here to access the Geographic and Temporal Analysis.
Data release: Topic-Specific Atlases - Social Health Atlas of Older People in Australia
The Older people in Australia: Social Health Atlas of Australia, presents data on a range of population characteristics, including demography, socioeconomic status, health status and risk factors, and use of health and welfare services. This is available by Population Health Areas (PHA), Local Government Areas (LGA), Primary Health Networks (PHN), Aged Care Planning Regions (ACPR), Remoteness Area and Quintiles of Socioeconomic Disadvantage of Area.
Click hereto access the maps for these atlases.
Click hereto access the graphs for these atlases.
Click hereto access the data for these atlases.
Data release: By Population Health Area, Local Government Area, Primary Health Network
Social Health Atlases of Australia
The topics and indicators in this latest release are listed below. Click the matrix table below to view the data and the format by which they are published.
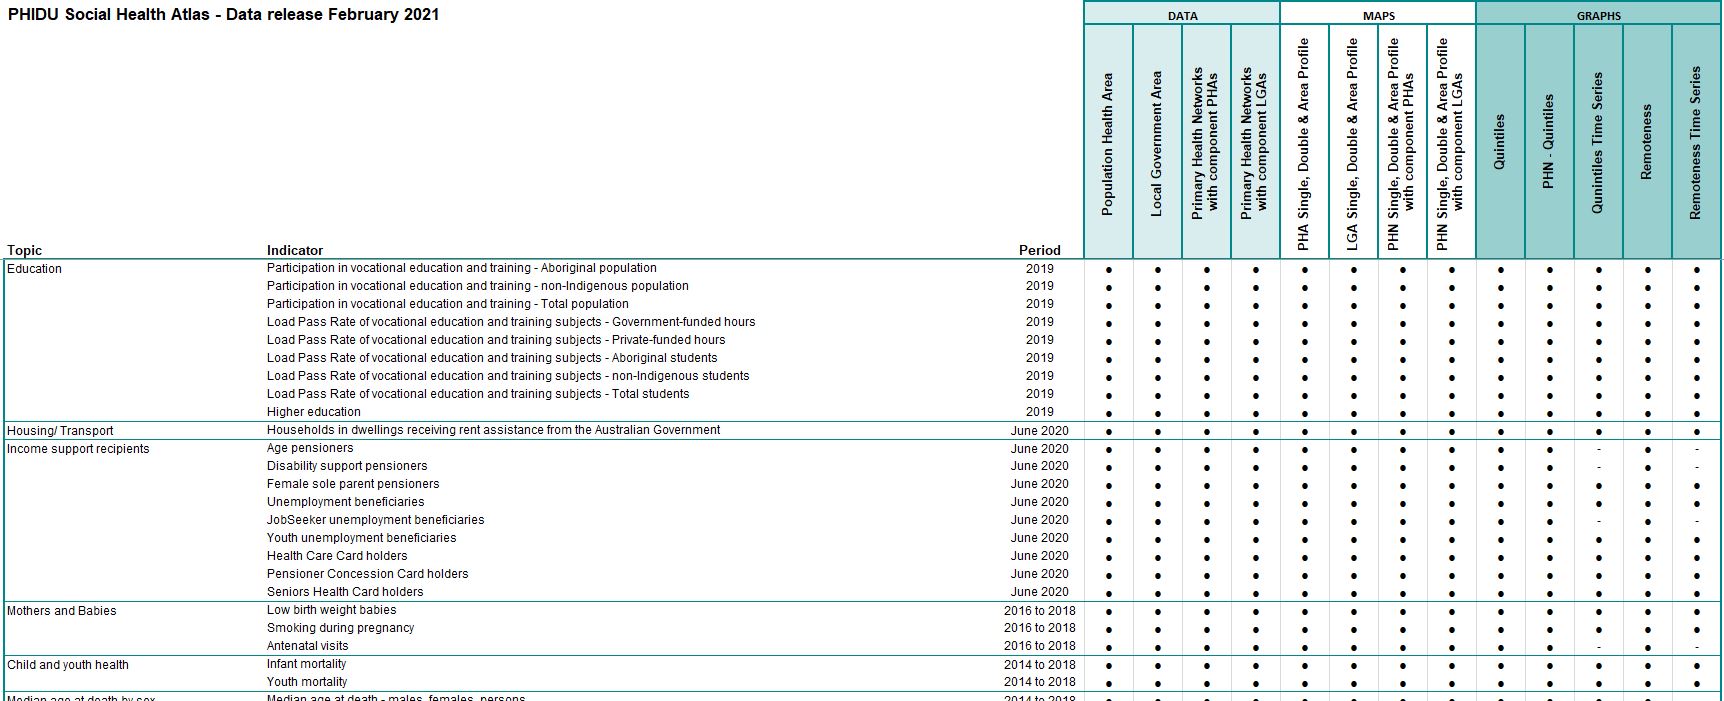
Income support
- Age Pensions – Department for Veterans’ Affairs recipients, June 2020
Admissions by hospital type and sex (excluding same-day admissions for renal dialysis)
- Male total admissions - Public/All hospitals, 2018/19
- Female total admissions - Public/All hospitals, 2018/19
- Total admissions - Public/Private/All hospitals, 2018/19
Admissions by principal diagnosis - Males, Females, Persons
- Infectious and parasitic diseases - Public/All hospitals, 2018/19
- All cancers - Public/All hospitals, 2018/19
- Endocrine, nutritional and metabolic diseases - Public/All hospitals, 2018/19
- - Diabetes - Public/All hospitals, 2018/19
- Mental health-related conditions - Public/All hospitals, 2018/19
- - Mood affective disorders - Public/All hospitals, 2018/19
- Nervous system diseases - Public/All hospitals, 2018/19
- Eye and adnexa diseases - Public/All hospitals, 2018/19
- Ear and mastoid process diseases - Public/All hospitals, 2018/19
- Circulatory system diseases - Public/All hospitals, 2018/19
- - Ischaemic heart disease - Public/All hospitals, 2018/19
- - Heart failure - Public/All hospitals, 2018/19
- - Stroke - Public/All hospitals, 2018/19
- Respiratory system diseases - Public/All hospitals, 2018/19
- - Asthma - Public/All hospitals, 2018/19
- - Chronic Obstructive Pulmonary Disease (COPD) - Public/All hospitals, 2018/19
- Digestive system diseases - Public/All hospitals, 2018/19
- Skin and subcutaneous tissue diseases - Public/All hospitals, 2018/19
- Musculoskeletal system and connective tissue diseases - Public/All hospitals, 2018/19
- Genitourinary system diseases - Public/All hospitals, 2018/19
- - Chronic kidney disease - Public/All hospitals, 2018/19
- Pregnancy and childbirth 15 to 44 years, Females only - Public/All hospitals, 2018/19
- Certain conditions originating in the perinatal period - Public/All hospitals, 2018/19
- Congenital malformations, deformations and chromosomal abnormalities - Public/All hospitals, 2018/19
- Injury, poisoning and other external causes - Public/All hospitals, 2018/19
Admissions by principal diagnosis of injury or poisoning, by external cause - Males, Females, Persons
- Transport crash Injury - Public/All hospitals, 2018/19
- Accidental poisoning, Persons only - Public/All hospitals, 2018/19
- Falls - Public/All hospitals, 2018/19
- Injury due to exposure to inanimate mechanical forces - Public/All hospitals, 2018/19
- Injury due to exposure to animate mechanical forces - Public/All hospitals, 2018/19
- Intentional self-harm - Public/All hospitals, 2018/19
- Assault - Public/All hospitals, 2018/19
- Other diagnosis of injury or poisoning, by external cause - Public/All hospitals, 2018/19
- All diagnosis of injury or poisoning, by external cause - Public/All hospitals, 2018/19
Admissions by procedure
- Tonsillectomy - Public/Private/All hospitals, 2018/19
- Myringotomy, 0 to 9 years - Public/Private/All hospitals, 2018/19
- Hysterectomy, females aged 30 to 59 years - Public/Private/All hospitals, 2018/19
- Caesarean section, females aged 15 to 44 years - Public/Private/All hospitals, 2018/19
- Coronary artery bypass graft - Public/Private/All hospitals, 2018/19
- Coronary angioplasty - Public/Private/All hospitals, 2018/19
- Cardiac catheterisation - Public/Private/All hospitals, 2018/19
- Hip fracture - Public/Private/All hospitals, 2018/19
- Knee replacement - Public/Private/All hospitals, 2018/19
- Knee arthroscopy - Public/Private/All hospitals, 2018/19
- Fibre optic colonoscopy - Public/Private/All hospitals, 2018/19
- Fibre optic colonoscopy excision - Public/Private/All hospitals, 2018/19
Same-day admissions for renal dialysis
- Same-day dialysis for kidney disease - Public/All hospitals, 2018/19
- Same-day dialysis for kidney disease - All hospitals, 2018/19
Potentially preventable hospitalisations - by broad age group
- Potentially preventable conditions, aged 0 to 14 years - Public/All hospitals, 2018/19
- Potentially preventable conditions, aged 15 to 24 years - Public/All hospitals, 2018/19
- Potentially preventable conditions, aged 25 to 44 years - Public/All hospitals, 2018/19
- Potentially preventable conditions, aged 45 to 64 years - Public/All hospitals, 2018/19
- Potentially preventable conditions, aged 65 years and over - Public/All hospitals, 2018/19
- Potentially preventable conditions, aged 15 years and over - Public/All hospitals, 2018/19
- All potentially preventable conditions - Public/All hospitals, 2018/19
Potentially preventable hospitalisations - Vaccine-preventable conditions
- Vaccine-preventable conditions - pneumonia and influenza - Public/All hospitals, 2018/19
- Vaccine-preventable conditions - other - Public/All hospitals, 2018/19
- Total vaccine-preventable conditions - Public/All hospitals, 2018/19
Potentially preventable hospitalisations - Acute conditions
- Acute cellulitis - Public/All hospitals, 2018/19
- Acute convulsions and epilepsy - Public/All hospitals, 2018/19
- Acute dental conditions - Public/All hospitals, 2018/19
- Acute ear, nose and throat infections - Public/All hospitals, 2018/19
- Acute urinary tract infections, including pyelonephritis - Public/All hospitals, 2018/19
- Other acute conditions - Public/All hospitals, 2018/19
- Total acute conditions - Public/All hospitals, 2018/19
Potentially preventable hospitalisations - Chronic conditions
- Chronic angina - Public/All hospitals, 2018/19
- Chronic asthma - Public/All hospitals, 2018/19
- Chronic congestive cardiac failure - Public/All hospitals, 2018/19
- Chronic Obstructive Pulmonary Disease (COPD) - Public/All hospitals, 2018/19
- Chronic diabetes complications - Public/All hospitals, 2018/19
- Chronic iron deficiency anaemia - Public/All hospitals, 2018/19
- Other chronic conditions - Public/All hospitals, 2018/19
- Total chronic conditions - Public/All hospitals, 2018/19
Emergency department presentations, total - by triage category
- Resuscitation presentations - Total, 2018/19
- Emergency presentations - Total, 2018/19
- Urgent presentations - Total, 2018/19
- Semi-urgent presentations - Total, 2018/19
- Non-urgent presentations - Total, 2018/19
Emergency department presentations, total - by principal diagnosis
- Total presentations, 2018/19
- Total presentations for certain infectious and parasitic diseases, 2018/19
- Total presentations for mental and behavioural disorders, 2018/19
- Total presentations for diseases of the circulatory system, 2018/19
- Total presentations for diseases of the respiratory system, 2018/19
- Total presentations for diseases of the digestive system, 2018/19
- Total presentations for diseases of the musculoskeletal system and connective tissue, 2018/19
- Total presentations for diseases of the genitourinary system, 2018/19
- Total presentations for injury, poisoning and certain other consequences of external causes, 2018/19
- Total presentations for factors influencing health status and contact with health services, 2018/19
- Total presentations for other diseases/ conditions, 2018/19
Emergency department presentations, total - by triage category
- Total presentations, 2018/19
- Resuscitation presentations, 2018/19
- Emergency presentations, 2018/19
- Urgent presentations, 2018/19
- Semi-urgent presentations, 2018/19
- Non-urgent presentations, 2018/19
- Total presentations, 2018/19
- Certain infectious and parasitic diseases, 2018/19
- Mental and behavioural disorders, 2018/19
- Diseases of the circulatory system, 2018/19
- Diseases of the respiratory system, 2018/19
- Diseases of the digestive system, 2018/19
- Diseases of the musculoskeletal system and connective tissue, 2018/19
- Diseases of the genitourinary system, 2018/19
- Injury, poisoning and certain other consequences of external causes, 2018/19
- Factors influencing health status and contact with health services, 2018/19
- Other diseases/ conditions, 2018/19
Emergency department presentations, by age and sex
- Male, Female, Total presentations, by broad age group, 2018/19
Emergency department presentations for certain infectious and parasitic diseases, by age and sex
- Male, Female, Total presentations, by broad age group, 2018/19
Emergency department presentations for mental and behavioural disorders, by age and sex
- Male, Female, Total presentations, by broad age group, 2018/19
Emergency department presentations for diseases of the circulatory system, by age and sex
- Male, Female, Total presentations, by broad age group, 2018/19
Emergency department presentations for diseases of the respiratory system, by age and sex
- Male, Female, Total presentations, by broad age group, 2018/19
Emergency department presentations for diseases of the digestive system, by age
- Total presentations, by broad age group, 2018/19
Emergency department presentations for diseases of the musculoskeletal system and connective tissue, by age
- Total presentations, by broad age group, 2018/19
Emergency department presentations for diseases of the genitourinary system, by age and sex
- Male, Female, Total presentations, by broad age group, 2018/19
Emergency department presentations for Injury, poisoning and certain other consequences of external causes, by age and sex
- Male, Female, Total presentations, by broad age group, 2018/19
Emergency department presentations for factors influencing health status and contact with health services, by age
- Total presentations, by broad age group, 2018/19
Emergency department presentations for other diseases/ conditions, by age
- Total presentations, by broad age group, 2018/19
Click hereto access the maps for these atlases.
Click hereto access the data for these atlases.
Data release: By quintile of socioeconomic disadvantage of area (including within Primary Health Networks) and Remoteness Area
Social Health Atlases of Australia
The topics and indicators in this latest release are listed below. Click the matrix table below to view the data and the format by which they are published.
Income support
- Age Pensions – Department for Veterans’ Affairs recipients, June 2020
Admissions by hospital type and sex (excluding same-day admissions for renal dialysis)
- Male total admissions - Public/All hospitals, 2018/19
- Female total admissions - Public/All hospitals, 2018/19
- Total admissions - Public/Private/All hospitals, 2018/19
Admissions by principal diagnosis - Males, Females, Persons
- Infectious and parasitic diseases - Public/All hospitals, 2018/19
- All cancers - Public/All hospitals, 2018/19
- Endocrine, nutritional and metabolic diseases - Public/All hospitals, 2018/19
- - Diabetes - Public/All hospitals, 2018/19
- Mental health-related conditions - Public/All hospitals, 2018/19
- - Mood affective disorders - Public/All hospitals, 2018/19
- Nervous system diseases - Public/All hospitals, 2018/19
- Eye and adnexa diseases - Public/All hospitals, 2018/19
- Ear and mastoid process diseases - Public/All hospitals, 2018/19
- Circulatory system diseases - Public/All hospitals, 2018/19
- - Ischaemic heart disease - Public/All hospitals, 2018/19
- - Heart failure - Public/All hospitals, 2018/19
- - Stroke - Public/All hospitals, 2018/19
- Respiratory system diseases - Public/All hospitals, 2018/19
- - Asthma - Public/All hospitals, 2018/19
- - Chronic Obstructive Pulmonary Disease (COPD) - Public/All hospitals, 2018/19
- Digestive system diseases - Public/All hospitals, 2018/19
- Skin and subcutaneous tissue diseases - Public/All hospitals, 2018/19
- Musculoskeletal system and connective tissue diseases - Public/All hospitals, 2018/19
- Genitourinary system diseases - Public/All hospitals, 2018/19
- - Chronic kidney disease - Public/All hospitals, 2018/19
- Pregnancy and childbirth 15 to 44 years, Females only - Public/All hospitals, 2018/19
- Certain conditions originating in the perinatal period - Public/All hospitals, 2018/19
- Congenital malformations, deformations and chromosomal abnormalities - Public/All hospitals, 2018/19
- Injury, poisoning and other external causes - Public/All hospitals, 2018/19
Admissions by principal diagnosis of injury or poisoning, by external cause - Males, Females, Persons
- Transport crash Injury - Public/All hospitals, 2018/19
- Accidental poisoning, Persons only - Public/All hospitals, 2018/19
- Falls - Public/All hospitals, 2018/19
- Injury due to exposure to inanimate mechanical forces - Public/All hospitals, 2018/19
- Injury due to exposure to animate mechanical forces - Public/All hospitals, 2018/19
- Intentional self-harm - Public/All hospitals, 2018/19
- Assault - Public/All hospitals, 2018/19
- Other diagnosis of injury or poisoning, by external cause - Public/All hospitals, 2018/19
- All diagnosis of injury or poisoning, by external cause - Public/All hospitals, 2018/19
Admissions by procedure
- Tonsillectomy - Public/Private/All hospitals, 2018/19
- Myringotomy, 0 to 9 years - Public/Private/All hospitals, 2018/19
- Hysterectomy, females aged 30 to 59 years - Public/Private/All hospitals, 2018/19
- Caesarean section, females aged 15 to 44 years - Public/Private/All hospitals, 2018/19
- Coronary artery bypass graft - Public/Private/All hospitals, 2018/19
- Coronary angioplasty - Public/Private/All hospitals, 2018/19
- Cardiac catheterisation - Public/Private/All hospitals, 2018/19
- Hip fracture - Public/Private/All hospitals, 2018/19
- Knee replacement - Public/Private/All hospitals, 2018/19
- Knee arthroscopy - Public/Private/All hospitals, 2018/19
- Fibre optic colonoscopy - Public/Private/All hospitals, 2018/19
- Fibre optic colonoscopy excision - Public/Private/All hospitals, 2018/19
Same-day admissions for renal dialysis
- Same-day dialysis for kidney disease - Public/All hospitals, 2018/19
- Same-day dialysis for kidney disease - All hospitals, 2018/19
Potentially preventable hospitalisations - by broad age group
- Potentially preventable conditions, aged 0 to 14 years - Public/All hospitals, 2018/19
- Potentially preventable conditions, aged 15 to 24 years - Public/All hospitals, 2018/19
- Potentially preventable conditions, aged 25 to 44 years - Public/All hospitals, 2018/19
- Potentially preventable conditions, aged 45 to 64 years - Public/All hospitals, 2018/19
- Potentially preventable conditions, aged 65 years and over - Public/All hospitals, 2018/19
- Potentially preventable conditions, aged 15 years and over - Public/All hospitals, 2018/19
- All potentially preventable conditions - Public/All hospitals, 2018/19
Potentially preventable hospitalisations - Vaccine-preventable conditions
- Vaccine-preventable conditions - pneumonia and influenza - Public/All hospitals, 2018/19
- Vaccine-preventable conditions - other - Public/All hospitals, 2018/19
- Total vaccine-preventable conditions - Public/All hospitals, 2018/19
Potentially preventable hospitalisations - Acute conditions
- Acute cellulitis - Public/All hospitals, 2018/19
- Acute convulsions and epilepsy - Public/All hospitals, 2018/19
- Acute dental conditions - Public/All hospitals, 2018/19
- Acute ear, nose and throat infections - Public/All hospitals, 2018/19
- Acute urinary tract infections, including pyelonephritis - Public/All hospitals, 2018/19
- Other acute conditions - Public/All hospitals, 2018/19
- Total acute conditions - Public/All hospitals, 2018/19
Potentially preventable hospitalisations - Chronic conditions
- Chronic angina - Public/All hospitals, 2018/19
- Chronic asthma - Public/All hospitals, 2018/19
- Chronic congestive cardiac failure - Public/All hospitals, 2018/19
- Chronic Obstructive Pulmonary Disease (COPD) - Public/All hospitals, 2018/19
- Chronic diabetes complications - Public/All hospitals, 2018/19
- Chronic iron deficiency anaemia - Public/All hospitals, 2018/19
- Other chronic conditions - Public/All hospitals, 2018/19
- Total chronic conditions - Public/All hospitals, 2018/19
Emergency department presentations, total - by triage category
- Resuscitation presentations - Total, 2018/19
- Emergency presentations - Total, 2018/19
- Urgent presentations - Total, 2018/19
- Semi-urgent presentations - Total, 2018/19
- Non-urgent presentations - Total, 2018/19
Emergency department presentations, total - by principal diagnosis
- Total presentations, 2018/19
- Total presentations for certain infectious and parasitic diseases, 2018/19
- Total presentations for mental and behavioural disorders, 2018/19
- Total presentations for diseases of the circulatory system, 2018/19
- Total presentations for diseases of the respiratory system, 2018/19
- Total presentations for diseases of the digestive system, 2018/19
- Total presentations for diseases of the musculoskeletal system and connective tissue, 2018/19
- Total presentations for diseases of the genitourinary system, 2018/19
- Total presentations for injury, poisoning and certain other consequences of external causes, 2018/19
- Total presentations for factors influencing health status and contact with health services, 2018/19
- Total presentations for other diseases/ conditions, 2018/19
Emergency department presentations, total - by triage category
- Total presentations, 2018/19
- Resuscitation presentations, 2018/19
- Emergency presentations, 2018/19
- Urgent presentations, 2018/19
- Semi-urgent presentations, 2018/19
- Non-urgent presentations, 2018/19
Emergency department presentations, by principal diagnosis
- Total presentations, 2018/19
- Certain infectious and parasitic diseases, 2018/19
- Mental and behavioural disorders, 2018/19
- Diseases of the circulatory system, 2018/19
- Diseases of the respiratory system, 2018/19
- Diseases of the digestive system, 2018/19
- Diseases of the musculoskeletal system and connective tissue, 2018/19
- Diseases of the genitourinary system, 2018/19
- Injury, poisoning and certain other consequences of external causes, 2018/19
- Factors influencing health status and contact with health services, 2018/19
- Other diseases/ conditions, 2018/19
Emergency department presentations, by age and sex
- Male, Female, Total presentations, by broad age group, 2018/19
Emergency department presentations for certain infectious and parasitic diseases, by age and sex
- Male, Female, Total presentations, by broad age group, 2018/19
Emergency department presentations for mental and behavioural disorders, by age and sex
- Male, Female, Total presentations, by broad age group, 2018/19
Emergency department presentations for diseases of the circulatory system, by age and sex
- Male, Female, Total presentations, by broad age group, 2018/19
Emergency department presentations for diseases of the respiratory system, by age and sex
- Male, Female, Total presentations, by broad age group, 2018/19
Emergency department presentations for diseases of the digestive system, by age
- Total presentations, by broad age group, 2018/19
Emergency department presentations for diseases of the musculoskeletal system and connective tissue, by age
- Total presentations, by broad age group, 2018/19
Emergency department presentations for diseases of the genitourinary system, by age and sex
- Male, Female, Total presentations, by broad age group, 2018/19
Emergency department presentations for Injury, poisoning and certain other consequences of external causes, by age and sex
- Male, Female, Total presentations, by broad age group, 2018/19
Emergency department presentations for factors influencing health status and contact with health services, by age
- Total presentations, by broad age group, 2018/19
Emergency department presentations for other diseases/ conditions, by age
- Total presentations, by broad age group, 2018/19
Click hereto access the graphs.
Click hereto access the data.
Data release: 7 May 2021
Data release: Topic-Specific Atlases - Child and Youth Social Health Atlas of Australia
Being healthy in childhood and as young people provides an important foundation for later life. This Child and Youth Social Health Atlas of Australia draws together data from other Social Health Atlases and unpublished data for those aged from 0 to 24 years. As such, it seeks to set the data on health status, use of health services and health outcomes alongside the demographic, social and economic characteristics of this population group in the communities where they live across Australia.
Click hereto access the maps for these atlases.
Click hereto access the graphs for these atlases.
Click hereto access the data for these atlases.
Data release: By Population Health Area, Local Government Area, Primary Health Network
Social Health Atlases of Australia
The topics and indicators in this latest release are listed below. Click the matrix table below to view the data and the format by which they are published.
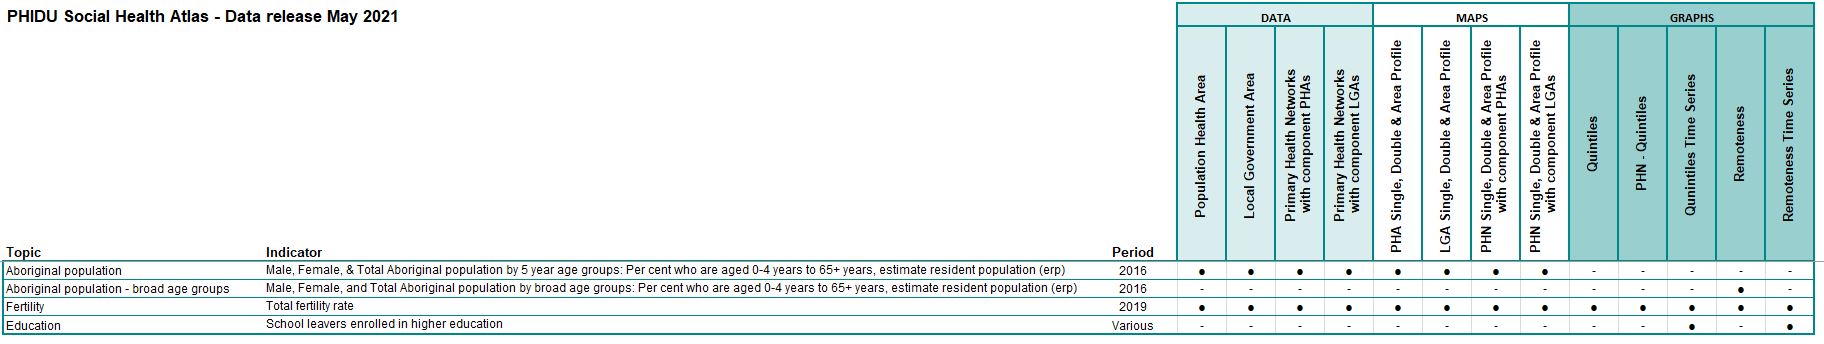
Aboriginal population
- Male, Female, & Total Aboriginal population by 5 year age groups: Per cent who are aged 0-4 years to 65+ years, estimate resident population (erp), 2016
Fertility
- Total fertility rate, 2019
Click hereto access the maps for these atlases.
Click hereto access the data for these atlases.
Data release: By quintile of socioeconomic disadvantage of area (including within Primary Health Networks) and Remoteness Area
Social Health Atlases of Australia
The topics and indicators in this latest release are listed below. Click the matrix table below to view the data and the format by which they are published.
Aboriginal population
- Male, Female, and Total Aboriginal population by broad age groups: Per cent who are aged 0-4 years to 65+ years, estimate resident population (erp), 2016 (Remoteness Area only)
Fertility
- Total fertility rate, 2019
Click hereto access the graphs.
Click hereto access the data.
Data release: By quintile of socioeconomic disadvantage of area time series and Remoteness Area time series
Social Health Atlases of Australia
The topics and indicators in this latest release are listed below. Click the matrix table below to view the data and the format by which they are published.
Fertility
- Total fertility rate, 2019
Education
- School leavers enrolled in higher education - Australia, and Victoria, various time periods
Click hereto access the graphs.
Click hereto access the data.
Data release: 25 February 2021
Atlases
Data release: Topic-Specific Atlases - Indigenous Status Comparison: Social Health Atlas of Australia
The Indigenous Status Comparison: Social Health Atlas of Australia, presents selected topics and compares indicators between Indigenous and Non-Indigenous populations in Australia. This is available by Indigenous Areas, including total for the Greater Capital City Statistical Areas/Rest of States/NT; and States/Territories.
Families
- Indigenous/ Non-Indigenous children in families where the mother has low educational attainment, 2016
Mothers and Babies
- Low birthweight Indigenous/ Non-Indigenous babies, 2016 to 2018
- Indigenous/ Non-Indigenous women smoking during pregnancy, 2016 to 2018
- Indigenous/ Non-Indigenous antenatal visits below recommended level, 2016 to 2018
Median age at death
- Median age at death of Indigenous/ Non-Indigenous - males, females, persons, 2014 to 2018
Premature mortality by sex
- Indigenous/ Non-Indigenous premature deaths - males, females, persons broad age groups, 2014 to 2018
Premature mortality by selected cause
- Cancers, Indigenous/ Non-Indigenous persons: 0 to 54 years, 2014 to 2018
- Circulatory system diseases, Indigenous/ Non-Indigenous persons: 0 to 54 years, 2014 to 2018
- Respiratory system diseases, Indigenous/ Non-Indigenous persons: 0 to 54 years, 2014 to 2018
- External causes, Indigenous/ Non-Indigenous persons: 0 to 54 years, 2014 to 2018
- Cancers, Indigenous/ Non-Indigenous persons: 0 to 64 years, 2014 to 2018
- Circulatory system diseases, Indigenous/ Non-Indigenous persons: 0 to 64 years, 2014 to 2018
- Respiratory system diseases, Indigenous/ Non-Indigenous persons: 0 to 64 years, 2014 to 2018
- External causes, Indigenous/ Non-Indigenous persons: 0 to 64 years, 2014 to 2018
- Cancers, Indigenous/ Non-Indigenous persons: 0 to 74 years, 2014 to 2018
- Diabetes, Indigenous/ Non-Indigenous persons: 0 to 74 years, 2014 to 2018
- Circulatory system diseases, Indigenous/ Non-Indigenous persons: 0 to 74 years, 2014 to 2018
- Respiratory system diseases, Indigenous/ Non-Indigenous persons: 0 to 74 years, 2014 to 2018
- External causes, Indigenous/ Non-Indigenous persons: 0 to 74 years, 2014 to 2018
Avoidable mortality by sex
- Deaths from all avoidable causes, Indigenous/ Non-Indigenous - males, females, persons broad age groups, 2014 to 2018
Avoidable mortality by selected cause
- Avoidable deaths from cancer, Indigenous/ Non-Indigenous persons aged 0 to 74 years, 2014 to 2018
- Avoidable deaths from diabetes, Indigenous/ Non-Indigenous persons aged 0 to 74 years, 2014 to 2018
- Avoidable deaths from circulatory system diseases, Indigenous/ Non-Indigenous persons aged 0 to 74 years, 2014 to 2018
- Avoidable deaths from respiratory system diseases, Indigenous/ Non-Indigenous persons aged 0 to 74 years, 2014 to 2018
- Avoidable deaths from selected external causes, Indigenous/ Non-Indigenous persons aged 0 to 74 years, 2014 to 2018
- Avoidable deaths from other external causes, Indigenous/ Non-Indigenous persons aged 0 to 74 years, 2014 to 2018
Potential years of life lost by age and sex
- Indigenous/ Non-Indigenous potential years of life lost - males, females, persons broad age groups, 2014 to 2018
Potential years of life lost by selected cause
- Indigenous/ Non-Indigenous potential years of life lost from cancer, 2014 to 2018
- Indigenous/ Non-Indigenous potential years of life lost from diabetes, 2014 to 2018
- Indigenous/ Non-Indigenous potential years of life lost from circulatory system diseases, 2014 to 2018
- Indigenous/ Non-Indigenous potential years of life lost from respiratory system diseases, 2014 to 2018
- Indigenous/ Non-Indigenous potential years of life lost from external causes, 2014 to 2018
Click hereto access this atlas.
Data release: Topic-Specific Atlases - COVID-19 impact on unemployment benefits Atlas (October 2020): supplemented with Emergency Department (ED) presentations for mental health-related conditions (February 2021)
The COVID-19 impact on unemployment benefits atlas, released in October last year, acknowledged the impact of unemployment on health and wellbeing, with a particular reference to the association with mental health. In this release, data have been added for presentations at emergency departments for mental health-related conditions. These data, by age and sex, stand alone, but also have an interesting relationship with the unemployment data, which is best understood through the Double map atlas.
Click hereto access the maps for these atlases.
Click hereto access the graphs for these atlases.
Click hereto access the data for these atlases.
Data release: By Population Health Area, Local Government Area, Primary Health Network
Social Health Atlases of Australia
The topics and indicators in this latest release are listed below. Click the matrix table below to view the data and the format by which they are published.
Education
- Participation in vocational education and training - Aboriginal population, 2019
- Participation in vocational education and training - Non-Indigenous population, 2019
- Participation in vocational education and training Total population, 2019
- Load Pass Rate of vocational education and training subjects - Government-funded hours, 2019
- Load Pass Rate of vocational education and training subjects - Private-funded hours, 2019
- Load Pass Rate of vocational education and training subjects - Aboriginal students, 2019
- Load Pass Rate of vocational education and training subjects - Non-Indigenous students, 2019
- Load Pass Rate of vocational education and training subjects Total students, 2019
- Higher education, 2019
Housing/ Transport
- Households in dwellings receiving rent assistance from the Australian Government, June 2020
Income support recipients
- Age pensioners, June 2020
- Disability support pensioners, June 2020
- Female sole parent pensioners, June 2020
- Unemployment beneficiaries, June 2020
- JobSeeker unemployment beneficiaries, June 2020
- Youth unemployment beneficiaries, June 2020
- Health Care Card holders, June 2020
- Pensioner Concession Card holders, June 2020
- Seniors Health Card holders, June 2020
Mothers and Babies
- Low birthweight babies, 2016 to 2018
- Smoking during pregnancy, 2016 to 2018
- Antenatal visits below recommended level, 2016 to 2018
Child and youth health
- Infant mortality, 2014 to 2018
- Youth mortality, 2014 to 2018
Median age at death by sex
- Median age at death - males, females, persons, 2014 to 2018
Premature mortality by sex
- Total deaths - males, females, persons aged 0 to 74 years, 2014 to 2018
Premature mortality by selected cause
- Deaths from cancer, persons aged 0 to 74 years, 2014 to 2018
- Deaths from colorectal cancer, persons aged 0 to 74 years, 2014 to 2018
- Deaths from Lung cancer, persons aged 0 to 74 years, 2014 to 2018
- Deaths from breast cancer, persons aged 0 to 74 years, 2014 to 2018
- Deaths from endocrine, nutritional and metabolic diseases - deaths from diabetes, 0 to 74 years, 2014 to 2018
- Deaths from circulatory system diseases aged 0 to 74 years, 2014 to 2018
- Deaths from Ischaemic heart disease, persons aged 0 to 74 years, 2014 to 2018
- Deaths from cerebrovascular diseases, persons aged 0 to 74 years, 2014 to 2018
- Deaths from respiratory system diseases aged 0 to 74 years, 2014 to 2018
- Deaths from chronic obstructive pulmonary disease aged 0 to 74 years, persons aged 0 to 74 years, 2014 to 2018
- Deaths from external causes aged 0 to 74 years, 2014 to 2018
- Deaths from road traffic injuries, persons aged 0 to 74 years, 2014 to 2018
- Deaths from suicide and self-inflicted injuries, persons aged 0 to 74 years, 2014 to 2018
Avoidable mortality by sex
- Deaths from all avoidable causes - males, females, persons aged 0 to 74 years, 2014 to 2018
Avoidable mortality by selected cause
- Avoidable deaths from cancer, persons aged 0 to 74 years, 2014 to 2018
- Avoidable deaths from colorectal cancer, persons aged 0 to 74 years, 2014 to 2018
- Avoidable deaths from breast cancer, persons aged 0 to 74 years, 2014 to 2018
- Avoidable deaths from diabetes aged 0 to 74 years, 2014 to 2018
- Avoidable deaths from circulatory system diseases aged 0 to 74 years, 2014 to 2018
- Avoidable deaths from Ischaemic heart disease, persons aged 0 to 74 years, 2014 to 2018
- Avoidable deaths from cerebrovascular diseases, persons aged 0 to 74 years, 2014 to 2018
- Avoidable deaths from respiratory system diseases aged 0 to 74 years, 2014 to 2018
- Avoidable deaths from chronic obstructive pulmonary disease (COPD), persons aged 0 to 74 years, 2014 to 2018
- Avoidable deaths from selected external causes of mortality aged 0 to 74 years, 2014 to 2018
- Avoidable deaths from suicide and self-inflicted injuries, persons aged 0 to 74 years, 2014 to 2018
- Avoidable deaths from other external causes of mortality aged 0 to 74 years, 2014 to 2018
- Avoidable deaths from transport accidents, persons aged 0 to 74 years, 2014 to 2018
Potential years of life lost by sex
- Potential years of life lost - males, females, persons, 2014 to 2018
Potential years of life lost by selected cause
- Potential years of life lost from cancer, 2014 to 2018
- Potential years of life lost from colorectal cancer, 2014 to 2018
- Potential years of life lost from lung cancer, 2014 to 2018
- Potential years of life lost from breast cancer, 2014 to 2018
- Potential years of life lost from diabetes, 2014 to 2018
- Potential years of life lost from circulatory system diseases, 2014 to 2018
- Potential years of life lost from Ischaemic heart disease, 2014 to 2018
- Potential years of life lost from cerebrovascular diseases, 2014 to 2018
- Potential years of life lost from respiratory system diseases, 2014 to 2018
- Potential years of life lost from chronic obstructive pulmonary disease, 2014 to 2018
- Potential years of life lost from external causes, 2014 to 2018
- Potential years of life lost from road traffic injuries, 2014 to 2018
- Potential years of life lost from suicide and self-inflicted injuries, 2014 to 2018
Health workforce (by LGA, and PHN only)
- General Medical Practitioners, 2018
- Specialist Practitioners (as reported excluding GPs), 2018
- Unknown/Not applicable Medical Practitioners, 2018
- Total Medical Practitioners, 2018
- Registered Nurses only, 2018
- Registered Nurses who are also Midwives, 2018
- Total Registered Nurses, 2018
- Enrolled Nurses, 2018
- Midwives (may also be a Registered Nurse or Enrolled Nurse), 2018
- Total Nurses (Registered Nurses, Enrolled Nurses or Midwives, each person only counted once), 2018
- Dentists, 2018
- Total Dental Practitioners (includes Dentists, Oral health therapists, Dental hygienists, Dental therapists and Dental prosthetists), 2018
Click hereto access the maps for these atlases.
Click hereto access the data for these atlases.
Data release: By quintile of socioeconomic disadvantage of area (including within Primary Health Networks) and Remoteness Area
Social Health Atlases of Australia
The topics and indicators in this latest release are listed below. Click the matrix table below to view the data and the format by which they are published.
Education
- Participation in vocational education and training - Aboriginal population, 2019
- Participation in vocational education and training - Non-Indigenous population, 2019
- Participation in vocational education and training Total population, 2019
- Load Pass Rate of vocational education and training subjects - Government-funded hours, 2019
- Load Pass Rate of vocational education and training subjects - Private-funded hours, 2019
- Load Pass Rate of vocational education and training subjects - Aboriginal students, 2019
- Load Pass Rate of vocational education and training subjects - Non-Indigenous students, 2019
- Load Pass Rate of vocational education and training subjects Total students, 2019
- Higher education, 2019
Housing/ Transport
- Households in dwellings receiving rent assistance from the Australian Government, June 2020
Income support recipients
- Age pensioners, June 2020
- Disability support pensioners, June 2020
- Female sole parent pensioners, June 2020
- Unemployment beneficiaries, June 2020
- JobSeeker unemployment beneficiaries, June 2020
- Youth unemployment beneficiaries, June 2020
- Health Care Card holders, June 2020
- Pensioner Concession Card holders, June 2020
- Seniors Health Card holders, June 2020
Mothers and Babies
- Low birthweight babies, 2016 to 2018
- Smoking during pregnancy, 2016 to 2018
- Antenatal visits below recommended level, 2016 to 2018
Child and youth health
- Infant mortality, 2014 to 2018
- Youth mortality, 2014 to 2018
Median age at death by sex
- Median age at death - males, females, persons, 2014 to 2018
Premature mortality by sex
- Total deaths - males, females, persons aged 0 to 74 years, 2014 to 2018
Premature mortality by selected cause
- Deaths from cancer, persons aged 0 to 74 years, 2014 to 2018
- Deaths from colorectal cancer, persons aged 0 to 74 years, 2014 to 2018
- Deaths from Lung cancer, persons aged 0 to 74 years, 2014 to 2018
- Deaths from breast cancer, persons aged 0 to 74 years, 2014 to 2018
- Deaths from endocrine, nutritional and metabolic diseases - deaths from diabetes, 0 to 74 years, 2014 to 2018
- Deaths from circulatory system diseases aged 0 to 74 years, 2014 to 2018
- Deaths from Ischaemic heart disease, persons aged 0 to 74 years, 2014 to 2018
- Deaths from cerebrovascular diseases, persons aged 0 to 74 years, 2014 to 2018
- Deaths from respiratory system diseases aged 0 to 74 years, 2014 to 2018
- Deaths from chronic obstructive pulmonary disease aged 0 to 74 years, persons aged 0 to 74 years, 2014 to 2018
- Deaths from external causes aged 0 to 74 years, 2014 to 2018
- Deaths from road traffic injuries, persons aged 0 to 74 years, 2014 to 2018
- Deaths from suicide and self-inflicted injuries, persons aged 0 to 74 years, 2014 to 2018
Avoidable mortality by sex
- Deaths from all avoidable causes - males, females, persons aged 0 to 74 years, 2014 to 2018
Avoidable mortality by selected cause
- Avoidable deaths from cancer, persons aged 0 to 74 years, 2014 to 2018
- Avoidable deaths from colorectal cancer, persons aged 0 to 74 years, 2014 to 2018
- Avoidable deaths from breast cancer, persons aged 0 to 74 years, 2014 to 2018
- Avoidable deaths from diabetes aged 0 to 74 years, 2014 to 2018
- Avoidable deaths from circulatory system diseases aged 0 to 74 years, 2014 to 2018
- Avoidable deaths from Ischaemic heart disease, persons aged 0 to 74 years, 2014 to 2018
- Avoidable deaths from cerebrovascular diseases, persons aged 0 to 74 years, 2014 to 2018
- Avoidable deaths from respiratory system diseases aged 0 to 74 years, 2014 to 2018
- Avoidable deaths from chronic obstructive pulmonary disease (COPD), persons aged 0 to 74 years, 2014 to 2018
- Avoidable deaths from selected external causes of mortality aged 0 to 74 years, 2014 to 2018
- Avoidable deaths from suicide and self-inflicted injuries, persons aged 0 to 74 years, 2014 to 2018
- Avoidable deaths from other external causes of mortality aged 0 to 74 years, 2014 to 2018
- Avoidable deaths from transport accidents, persons aged 0 to 74 years, 2014 to 2018
Potential years of life lost by sex
- Potential years of life lost - males, females, persons, 2014 to 2018
Potential years of life lost by selected cause
- Potential years of life lost from cancer, 2014 to 2018
- Potential years of life lost from colorectal cancer, 2014 to 2018
- Potential years of life lost from lung cancer, 2014 to 2018
- Potential years of life lost from breast cancer, 2014 to 2018
- Potential years of life lost from diabetes, 2014 to 2018
- Potential years of life lost from circulatory system diseases, 2014 to 2018
- Potential years of life lost from Ischaemic heart disease, 2014 to 2018
- Potential years of life lost from cerebrovascular diseases, 2014 to 2018
- Potential years of life lost from respiratory system diseases, 2014 to 2018
- Potential years of life lost from chronic obstructive pulmonary disease, 2014 to 2018
- Potential years of life lost from external causes, 2014 to 2018
- Potential years of life lost from road traffic injuries, 2014 to 2018
- Potential years of life lost from suicide and self-inflicted injuries, 2014 to 2018
Health workforce (by LGA, and PHN only)
- General Medical Practitioners, 2018
- Specialist Practitioners (as reported excluding GPs), 2018
- Unknown/Not applicable Medical Practitioners, 2018
- Total Medical Practitioners, 2018
- Registered Nurses only, 2018
- Registered Nurses who are also Midwives, 2018
- Total Registered Nurses, 2018
- Enrolled Nurses, 2018
- Midwives (may also be a Registered Nurse or Enrolled Nurse), 2018
- Total Nurses (Registered Nurses, Enrolled Nurses or Midwives, each person only counted once), 2018
- Dentists, 2018
- Total Dental Practitioners (includes Dentists, Oral health therapists, Dental hygienists, Dental therapists and Dental prosthetists), 2018
Click hereto access the graphs.
Click hereto access the data.
Data release: By quintile of socioeconomic disadvantage of area time series and Remoteness Area time series
Social Health Atlases of Australia
The topics and indicators in this latest release are listed below. Click the matrix table below to view the data and the format by which they are published.
Education
- Participation in vocational education and training - Aboriginal population, 2019
- Participation in vocational education and training - Non-Indigenous population, 2019
- Participation in vocational education and training - total population, 2019
- Load Pass Rate of vocational education and training subjects - Government-funded hours, 2019
- Load Pass Rate of vocational education and training subjects - Private-funded hours, 2019
- Load Pass Rate of vocational education and training subjects - Aboriginal students, 2019
- Load Pass Rate of vocational education and training subjects - Non-Indigenous students, 2019
- Load Pass Rate of vocational education and training subjects Total students, 2019
- Higher education, 2019
Housing/ Transport
- Households in dwellings receiving rent assistance from the Australian Government, June 2020
Income support recipients
- Female sole parent pensioners, June 2020
- Unemployment beneficiaries, June 2020
- JobSeeker unemployment beneficiaries, June 2020
- Youth unemployment beneficiaries, June 2020
- Health Care Card holders, June 2020
- Pensioner Concession Card holders, June 2020
- Seniors Health Card holders, June 2020
Mothers and Babies
- Low birthweight babies, 2016 to 2018
- Smoking during pregnancy, 2016 to 2018
Child and youth health
- Infant mortality, 2014 to 2018
- Youth mortality, 2014 to 2018
Median age at death by sex (By quintile of socioeconomic disadvantage of area time series only)
- Median age at death - males, females, persons, 2014 to 2018
Premature mortality by sex
- Total deaths - males, females, persons aged 0 to 74 years, 2014 to 2018
Premature mortality by selected cause
- Deaths from cancer, persons aged 0 to 74 years, 2014 to 2018
- Deaths from colorectal cancer, persons aged 0 to 74 years, 2014 to 2018
- Deaths from Lung cancer, persons aged 0 to 74 years, 2014 to 2018
- Deaths from breast cancer, persons aged 0 to 74 years, 2014 to 2018
- Deaths from endocrine, nutritional and metabolic diseases - deaths from diabetes, 0 to 74 years, 2014 to 2018
- Deaths from circulatory system diseases aged 0 to 74 years, 2014 to 2018
- Deaths from Ischaemic heart disease, persons aged 0 to 74 years, 2014 to 2018
- Deaths from cerebrovascular diseases, persons aged 0 to 74 years, 2014 to 2018
- Deaths from respiratory system diseases aged 0 to 74 years, 2014 to 2018
- Deaths from chronic obstructive pulmonary disease aged 0 to 74 years, persons aged 0 to 74 years, 2014 to 2018
- Deaths from external causes aged 0 to 74 years, 2014 to 2018
- Deaths from road traffic injuries, persons aged 0 to 74 years, 2014 to 2018
- Deaths from suicide and self-inflicted injuries, persons aged 0 to 74 years, 2014 to 2018
Avoidable mortality by sex
- Deaths from all avoidable causes - males, females, persons aged 0 to 74 years, 2014 to 2018
Avoidable mortality by selected cause
- Avoidable deaths from cancer, persons aged 0 to 74 years, 2014 to 2018
- Avoidable deaths from colorectal cancer, persons aged 0 to 74 years, 2014 to 2018
- Avoidable deaths from breast cancer, persons aged 0 to 74 years, 2014 to 2018
- Avoidable deaths from diabetes aged 0 to 74 years, 2014 to 2018
- Avoidable deaths from circulatory system diseases aged 0 to 74 years, 2014 to 2018
- Avoidable deaths from Ischaemic heart disease, persons aged 0 to 74 years, 2014 to 2018
- Avoidable deaths from cerebrovascular diseases, persons aged 0 to 74 years, 2014 to 2018
- Avoidable deaths from respiratory system diseases aged 0 to 74 years, 2014 to 2018
- Avoidable deaths from chronic obstructive pulmonary disease (COPD), persons aged 0 to 74 years, 2014 to 2018
- Avoidable deaths from selected external causes of mortality aged 0 to 74 years, 2014 to 2018
- Avoidable deaths from suicide and self-inflicted injuries, persons aged 0 to 74 years, 2014 to 2018
- Avoidable deaths from other external causes of mortality aged 0 to 74 years, 2014 to 2018
- Avoidable deaths from transport accidents, persons aged 0 to 74 years, 2014 to 2018
Click hereto access the graphs.
Click hereto access the data.
Data release: By Indigenous Area, Primary Health Networks, quintile of Indigenous Relative Socioeconomic Outcomes and Remoteness Areas
Aboriginal & Torres Strait Islander Social Health Atlases of Australia
The topics and indicators in this latest release are listed below. Click the matrix table below to view the data and the format by which they are published.
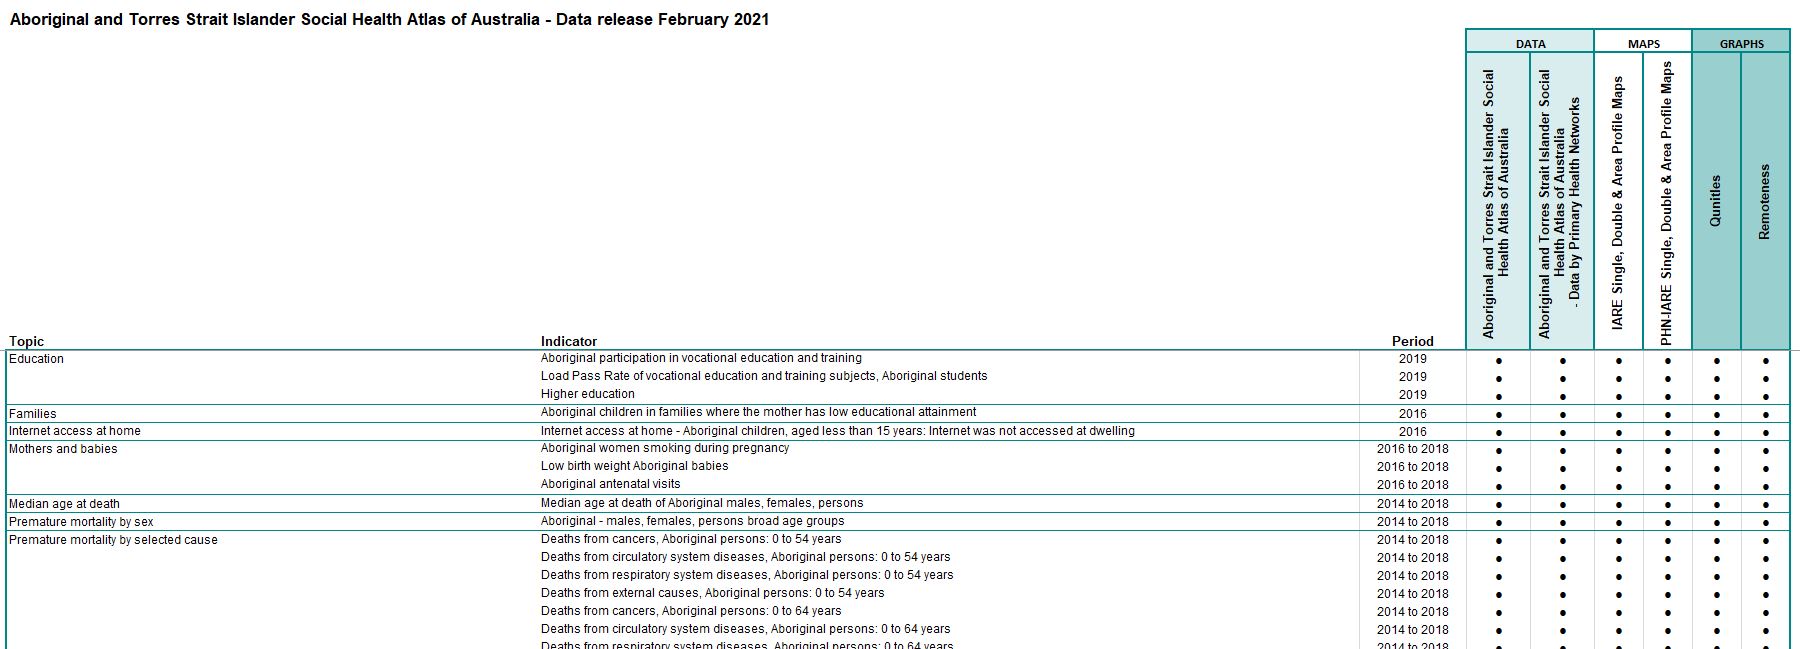
Education
- Aboriginal participation in vocational education and training, 2019
- Load Pass Rate of vocational education and training subjects, Aboriginal students, 2019
- Higher education, 2019
Families
- Aboriginal children in Aboriginal families where the mother has low educational attainment, 2016
Internet access at home
- Internet access at home - Aboriginal children, aged less than 15 years: Internet was not accessed at dwelling, 2016
Mothers and Babies
- Aboriginal women smoking during pregnancy, 2016 to 2018
- Low birthweight Aboriginal babies, 2016 to 2018
- Aboriginal antenatal visits below recommended levels, 2016 to 2018
Median age at death
- Median age at death of Aboriginal males, females, persons, 2014 to 2018
Premature mortality by sex
- Aboriginal - males, females, persons broad age groups, 2014 to 2018
Premature mortality by selected cause
- Deaths from cancers, Aboriginal persons: 0 to 54 years, 2014 to 2018
- Deaths from circulatory system diseases, Aboriginal persons: 0 to 54 years, 2014 to 2018
- Deaths from respiratory system diseases, Aboriginal persons: 0 to 54 years, 2014 to 2018
- Deaths from external causes, Aboriginal persons: 0 to 54 years, 2014 to 2018
- Deaths from cancers, Aboriginal persons: 0 to 64 years, 2014 to 2018
- Deaths from circulatory system diseases, Aboriginal persons: 0 to 64 years, 2014 to 2018
- Deaths from respiratory system diseases, Aboriginal persons: 0 to 64 years, 2014 to 2018
- Deaths from external causes, Aboriginal persons: 0 to 64 years, 2014 to 2018
- Deaths from cancers, Aboriginal persons: 0 to 74 years, 2014 to 2018
- Deaths from diabetes, Aboriginal persons: 0 to 74 years, 2014 to 2018
- Deaths from circulatory system diseases, Aboriginal persons: 0 to 74 years, 2014 to 2018
- Deaths from respiratory system diseases, Aboriginal persons: 0 to 74 years, 2014 to 2018
- Deaths from external causes, Aboriginal persons: 0 to 74 years, 2014 to 2018
Avoidable mortality by sex
- Deaths from all avoidable causes - Aboriginal males, females, persons aged 0 to 74 years, 2014 to 2018
Avoidable mortality by selected cause
- Avoidable deaths from cancer, Aboriginal persons aged 0 to 74 years, 2014 to 2018
- Avoidable deaths from diabetes, Aboriginal persons aged 0 to 74 years, 2014 to 2018
- Avoidable deaths from circulatory system diseases, Aboriginal persons aged 0 to 74 years, 2014 to 2018
- Avoidable deaths from respiratory system diseases, Aboriginal persons aged 0 to 74 years, 2014 to 2018
- Avoidable deaths from selected external causes, Aboriginal persons aged 0 to 74 years, 2014 to 2018
- Avoidable deaths from other external causes, Aboriginal persons aged 0 to 74 years, 2014 to 2018
Potential years of life lost by age and sex
- Aboriginal - males, females, persons broad age groups, 2014 to 2018
Potential years of life lost by selected cause
- Potential years of life lost from cancer, 2014 to 2018
- Potential years of life lost from diabetes, 2014 to 2018
- Potential years of life lost from circulatory system diseases, 2014 to 2018
- Potential years of life lost from respiratory system diseases, 2014 to 2018
- Potential years of life lost from external causes, 2014 to 2018
Click hereto access the maps for these atlases.
Click hereto access the data for these atlases.
Data tools
Data release: 25 February 2021 - Population pyramid tool
The population pyramid tool has been updated with the 2019 estimated resident population (ERP) for the whole population.
The Population pyramid generator allows you to generate population pyramids for the whole population and for the Aboriginal and Torres Strait Islander populations for a range of geographical areas.
Click hereto access the tool.
2020
Data release: 26 October 2020
Data release: Topic-Specific Atlases - COVID-19 impact on unemployment benefits
COVID-19 impact on unemployment benefits
One of the greatest impacts of the coronavirus (COVID-19) in Australia has been on jobs – in fact, the loss of jobs, as businesses have scaled down or closed. A major indicator of the impact of loss of jobs is the increase in the number of people receiving an unemployment benefit. In June 2019 there were just over three quarters of a million people receiving an unemployment benefit; by June 2020 this figure had more than doubled, to over one and a half million (the numbers are 769,555 and 1,614,412, respectively).
In this report we provide maps, graphs and data that show the major changes in the capital cities and regional areas, based on data from the Department of Social Services (DSS 2020).
Click here to access this Topic-specific atlas.
Data release: 24 September 2020
Data release: Topic-Specific Atlases - Indigenous Potentially Preventable Hospitalisations - "Hotspot" analysis
The latest Topic-specific atlases in this latest released are listed below. Click here to access this Topic-specific atlas.
Indigenous Potentially Preventable Hospitalisations - "Hotspot' analysis
-
The level of Potentially Preventable Hospitalisations (PPHs) is an accepted measure of health system performance and, despite its limitations, can geographically highlight areas of concern where rates of hospitalisation are high or to investigate why in other instances rates are low.
The aim of this study is to identify the geographic and temporal persistence of PPHs across Australia. It follows on from work by Duckett and Griffiths (2016) published as “Perils of Place: identifying hotspots of health inequalities”. This study provides a framework to identify the existence of areas with persistently high PPH rates over time known as “PPH hotspots” and provides core principles to highlight areas where interventions can be targeted. We hope that this new analysis, and its presentation in geographical maps, heat map graphs and data sheets, will provide information that is useful to the various levels of the health system, from state and territory health agencies to local and regional health networks and boards, PHNs and primary care practitioners, in working together with an aim to reducing the level of PPHs through improved primary health care outcomes at the local area level.
Data release: By Population Health Area, Local Government Area, Primary Health Network
Social Health Atlases of Australia
The topics and indicators in this latest release are listed below. Click the matrix table below to view the data and the format by which they are published.
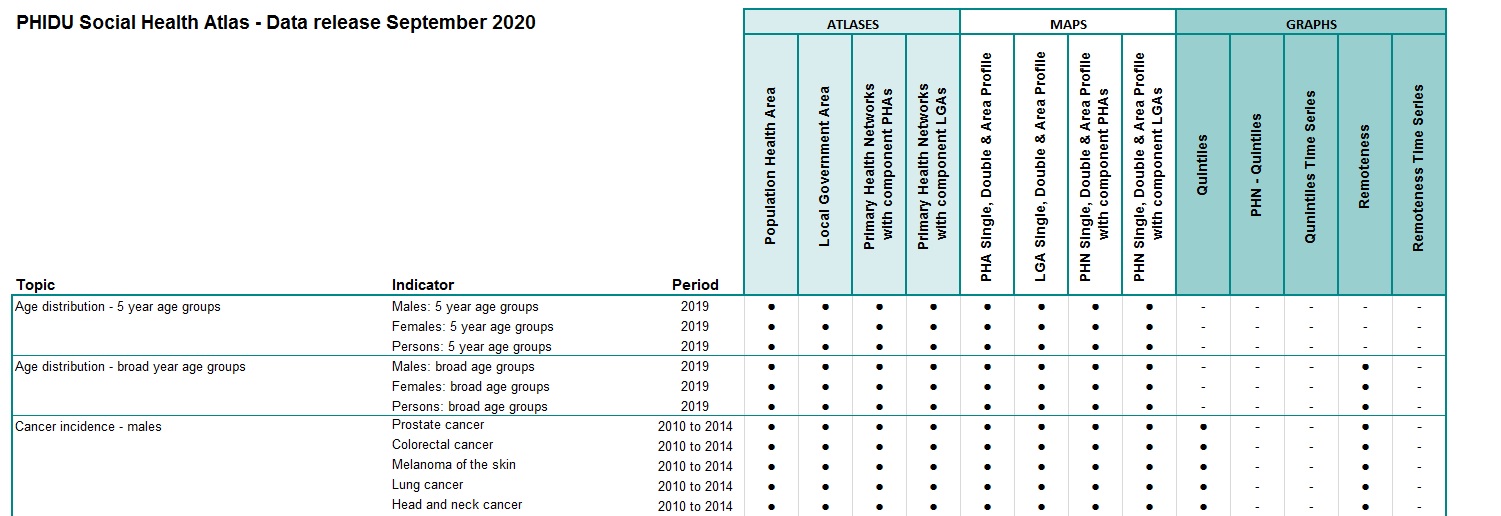
Age distribution - 5 year age groups
- Males/ Females/ Persons: 5 year age groups, 2019 ERP
Age distribution - broad age groups
- Males/ Females/ Persons: broad age groups, 2019 ERP
Cancer incidence - males
- Prostate cancer incidence, 2010 to 2014
- Colorectal cancer incidence, 2010 to 2014
- Melanoma of the skin incidence, 2010 to 2014
- Lung cancer incidence, 2010 to 2014
- Head and neck cancer incidence, 2010 to 2014
- Lymphoma cancer incidence, 2010 to 2014
- Leukaemia cancer incidence, 2010 to 2014
- Bladder cancer incidence, 2010 to 2014
- Kidney cancer incidence, 2010 to 2014
- Pancreatic cancer incidence, 2010 to 2014
- Stomach cancer incidence, 2010 to 2014
- All other cancer incidence, 2010 to 2014
- All cancer incidence, 2010 to 2014
Cancer incidence - females
- Breast cancer incidence, 2010 to 2014
- Colorectal cancer incidence, 2010 to 2014
- Melanoma of the skin incidence, 2010 to 2014
- Lung cancer incidence, 2010 to 2014
- Uterine cancer incidence, 2010 to 2014
- Lymphoma cancer incidence, 2010 to 2014
- Thyroid cancer incidence, 2010 to 2014
- Leukaemia cancer incidence, 2010 to 2014
- Ovarian cancer incidence, 2010 to 2014
- Pancreatic cancer incidence, 2010 to 2014
- All other cancer incidence, 2010 to 2014
- All cancer incidence, 2010 to 2014
Cancer incidence - persons
- Colorectal cancer incidence, 2010 to 2014
- Melanoma of the skin incidence, 2010 to 2014
- Lung cancer incidence, 2010 to 2014
- Lymphoma cancer incidence, 2010 to 2014
- Leukaemia cancer incidence, 2010 to 2014
- Pancreatic cancer incidence, 2010 to 2014
- All other cancer incidence, 2010 to 2014
- All cancer incidence, 2010 to 2014
Click hereto access the maps for these atlases.
Click hereto access the data for these atlases.
Data release: By quintile of socioeconomic disadvantage of area and Remoteness Area
Social Health Atlases of Australia
The topics and indicators in this latest release are listed below. Click the matrix table below to view the data and the format by which they are published.
Age distribution - broad age groups (remoteness only)
- Males/ Females/ Persons: broad age groups, 2019 ERP
Cancer incidence - males
- Prostate cancer incidence, 2010 to 2014
- Colorectal cancer incidence, 2010 to 2014
- Melanoma of the skin incidence, 2010 to 2014
- Lung cancer incidence, 2010 to 2014
- Head and neck cancer incidence, 2010 to 2014
- Lymphoma cancer incidence, 2010 to 2014
- Leukaemia cancer incidence, 2010 to 2014
- Bladder cancer incidence, 2010 to 2014
- Kidney cancer incidence, 2010 to 2014
- Pancreatic cancer incidence, 2010 to 2014
- Stomach cancer incidence, 2010 to 2014
- All other cancer incidence, 2010 to 2014
- All cancer incidence, 2010 to 2014
Cancer incidence - females
- Breast cancer incidence, 2010 to 2014
- Colorectal cancer incidence, 2010 to 2014
- Melanoma of the skin incidence, 2010 to 2014
- Lung cancer incidence, 2010 to 2014
- Uterine cancer incidence, 2010 to 2014
- Lymphoma cancer incidence, 2010 to 2014
- Thyroid cancer incidence, 2010 to 2014
- Leukaemia cancer incidence, 2010 to 2014
- Ovarian cancer incidence, 2010 to 2014
- Pancreatic cancer incidence, 2010 to 2014
- All other cancer incidence, 2010 to 2014
- All cancer incidence, 2010 to 2014
Cancer incidence - persons
- Colorectal cancer incidence, 2010 to 2014
- Melanoma of the skin incidence, 2010 to 2014
- Lung cancer incidence, 2010 to 2014
- Lymphoma cancer incidence, 2010 to 2014
- Leukaemia cancer incidence, 2010 to 2014
- Pancreatic cancer incidence, 2010 to 2014
- All other cancer incidence, 2010 to 2014
- All cancer incidence, 2010 to 2014
Click hereto access the graphs.
Click hereto access the data.
Data release: 28 August 2020
Data release: By Population Health Area, Local Government Area, Primary Health Network
Social Health Atlases of Australia
The topics and indicators in this latest release are listed below. Click the matrix table below to view the data and the format by which they are published.
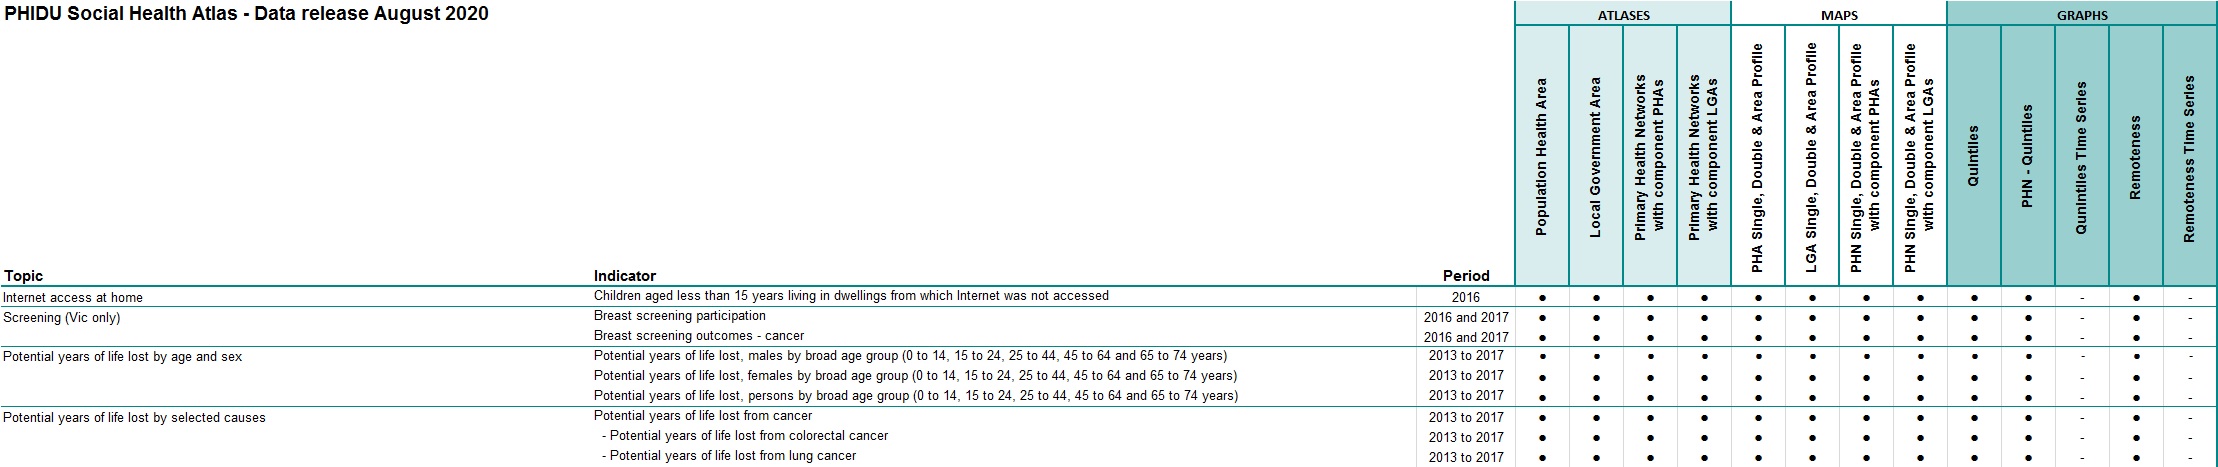
Internet access at home
- Children aged less than 15 years living in dwellings from which Internet was not accessed, 2016
Screening (Vic only)
- Breast screening participation, 2016 and 2017
- Breast screening outcomes - cancer, 2016 and 2017
Potential years of life lost by age and sex
- Potential years of life lost, males by broad age group (0 to 14, 15 to 24, 25 to 44, 45 to 64 and 65 to 74 years), 2013 to 2017
- Potential years of life lost, females by broad age group (0 to 14, 15 to 24, 25 to 44, 45 to 64 and 65 to 74 years), 2013 to 2017
- Potential years of life lost, persons by broad age group (0 to 14, 15 to 24, 25 to 44, 45 to 64 and 65 to 74 years), 2013 to 2017
Potential years of life lost by selected causes
- Potential years of life lost from cancer, 2013 to 2017
- - Potential years of life lost from colorectal cancer, 2013 to 2017
- - Potential years of life lost from lung cancer, 2013 to 2017
- - Potential years of life lost from breast cancer, 2013 to 2017
- Potential years of life lost from diabetes, 2013 to 2017
- Potential years of life lost from circulatory system diseases, 2013 to 2017
- - Potential years of life lost from ischaemic heart disease, 2013 to 2017
- - Potential years of life lost from cerebrovascular diseases, 2013 to 2017
- Potential years of life lost from respiratory system diseases, 2013 to 2017
- - Potential years of life lost from chronic obstructive pulmonary disease, 2013 to 2017
- Potential years of life lost from external causes, 2013 to 2017
- - Potential years of life lost from road traffic injuries, 2013 to 2017
- - Potential years of life lost from suicide and self-inflicted injuries, 2013 to 2017
Click hereto access the maps for these atlases.
Click hereto access the data for these atlases.
Data release: By quintile of socioeconomic disadvantage of area and Remoteness Area
Social Health Atlases of Australia
The topics and indicators in this latest release are listed below. Click the matrix table below to view the data and the format by which they are published.
Internet access at home
- Children aged less than 15 years living in dwellings from which Internet was not accessed, 2016
Screening (Vic only)
- Breast screening participation, 2016 and 2017
- Breast screening outcomes - cancer, 2016 and 2017
Potential years of life lost by age and sex
- Potential years of life lost, males by broad age group (0 to 14, 15 to 24, 25 to 44, 45 to 64 and 65 to 74 years), 2013 to 2017
- Potential years of life lost, females by broad age group (0 to 14, 15 to 24, 25 to 44, 45 to 64 and 65 to 74 years), 2013 to 2017
- Potential years of life lost, persons by broad age group (0 to 14, 15 to 24, 25 to 44, 45 to 64 and 65 to 74 years), 2013 to 2017
Potential years of life lost by selected causes
- Potential years of life lost from cancer, 2013 to 2017
- - Potential years of life lost from colorectal cancer, 2013 to 2017
- - Potential years of life lost from lung cancer, 2013 to 2017
- - Potential years of life lost from breast cancer, 2013 to 2017
- Potential years of life lost from diabetes, 2013 to 2017
- Potential years of life lost from circulatory system diseases, 2013 to 2017
- - Potential years of life lost from ischaemic heart disease, 2013 to 2017
- - Potential years of life lost from cerebrovascular diseases, 2013 to 2017
- Potential years of life lost from respiratory system diseases, 2013 to 2017
- - Potential years of life lost from chronic obstructive pulmonary disease, 2013 to 2017
- Potential years of life lost from external causes, 2013 to 2017
- - Potential years of life lost from road traffic injuries, 2013 to 2017
- - Potential years of life lost from suicide and self-inflicted injuries, 2013 to 2017
Click hereto access the maps for these atlases.
Click hereto access the data for these atlases.
Data release: By Indigenous Area, Primary Health Networks, quintile of Indigenous Relative Socioeconomic Outcomes and Remoteness Areas
Aboriginal & Torres Strait Islander Social Health Atlases of Australia
The topics and indicators in this latest release are listed below. Click the matrix table below to view the data and the format by which they are published.
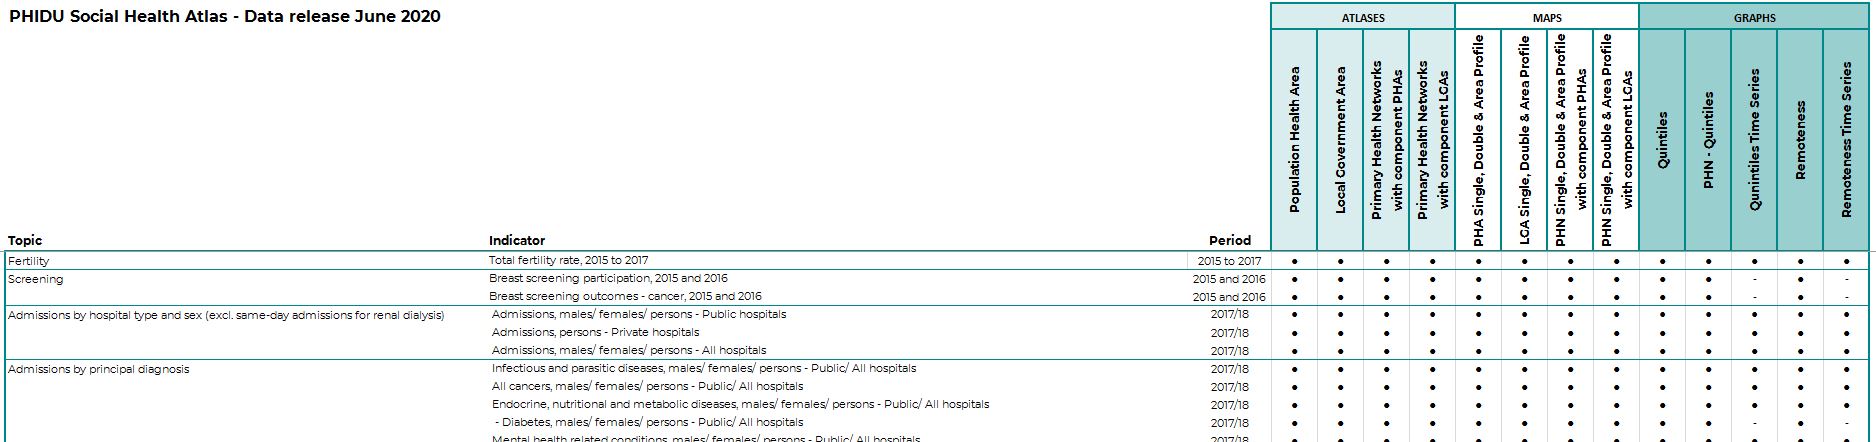
Potential years of life lost by age and sex
- Potential years of life lost, Aboriginal males/ females/ persons aged 0 to 54 years, 2013 to 2017
- Potential years of life lost, Aboriginal males/ females/ persons aged 0 to 64 years, 2013 to 2017
Potential years of life lost by selected causes
- Potential years of life lost from cancer (deaths of Aboriginal persons before 75 years of age), 2013 to 2017
- Potential years of life lost from diabetes (deaths of Aboriginal persons before 75 years of age), 2013 to 2017
- Potential years of life lost from circulatory system diseases (deaths of Aboriginal persons before 75 years of age), 2013 to 2017
- Potential years of life lost from respiratory system diseases (deaths of Aboriginal persons before 75 years of age), 2013 to 2017
- Potential years of life lost from external causes (deaths of Aboriginal persons before 75 years of age), 2013 to 2017
Admissions by sex (excluding same-day admissions for renal dialysis)
- Admissions, Aboriginal males/ females/ persons, 2015/16 to 2017/18
Admissions by age (excluding same-day admissions for renal dialysis)
- Admissions, Aboriginal persons aged 0 to 14, 15 to 24, 25 to 44, 45 to 64, 65 years and over and 15 years and over, 2015/16 to 2017/18
Admissions by selected principal diagnosis
- Infectious and parasitic diseases, Aboriginal persons, 2015/16 to 2017/18
- All cancers, Aboriginal persons, 2015/16 to 2017/18
- Endocrine, nutritional and metabolic diseases, Aboriginal persons, 2015/16 to 2017/18
- - Diabetes, Aboriginal persons, 2015/16 to 2017/18
- Mental health-related conditions, Aboriginal persons, 2015/16 to 2017/18
- - Mood affective disorders, Aboriginal persons, 2015/16 to 2017/18
- Nervous system diseases, Aboriginal persons, 2015/16 to 2017/18
- Eye and adnexa diseases, Aboriginal persons, 2015/16 to 2017/18
- Ear and mastoid process diseases, Aboriginal persons, 2015/16 to 2017/18
- Circulatory system diseases, Aboriginal persons, 2015/16 to 2017/18
- - Ischaemic heart disease, Aboriginal persons, 2015/16 to 2017/18
- - Heart failure, Aboriginal persons, 2015/16 to 2017/18
- Respiratory system diseases, Aboriginal persons, 2015/16 to 2017/18
- - Asthma, Aboriginal persons, 2015/16 to 2017/18
- - Chronic Obstructive Pulmonary Disease (COPD), Aboriginal persons, 2015/16 to 2017/18
- Digestive system diseases, Aboriginal persons, 2015/16 to 2017/18
- Skin and subcutaneous tissue diseases, Aboriginal persons, 2015/16 to 2017/18
- Musculoskeletal system and connective tissue diseases, Aboriginal persons, 2015/16 to 2017/18
- Genitourinary system diseases, Aboriginal persons, 2015/16 to 2017/18
- - Chronic kidney disease, Aboriginal persons, 2015/16 to 2017/18
- Pregnancy and childbirth 15 to 44 years, Aboriginal females, 2015/16 to 2017/18
- Congenital malformations, deformations and chromosomal abnormalities, Aboriginal persons, 2015/16 to 2017/18
- Injury, poisoning and other external causes, Aboriginal persons, 2015/16 to 2017/18
Admissions by selected principal diagnosis and age
- Infectious and parasitic diseases, Aboriginal persons aged 0 to 14 years and 15 years and over, 2015/16 to 2017/18
- Respiratory system diseases, Aboriginal persons aged 0 to 14 years and 15 years and over, 2015/16 to 2017/18
- Digestive system diseases, Aboriginal persons aged 0 to 14 years and 15 years and over, 2015/16 to 2017/18
- Skin and subcutaneous tissue diseases, Aboriginal persons aged 0 to 14 years and 15 years and over, 2015/16 to 2017/18
- Injury, poisoning and other external causes, Aboriginal persons aged 0 to 14 years and 15 years and over, 2015/16 to 2017/18
Admissions by principal diagnosis of injury or poisoning, by external cause
- Transport crash Injury, Aboriginal persons, 2015/16 to 2017/18
- Falls, Aboriginal persons, 2015/16 to 2017/18
- Injury due to exposure to inanimate mechanical forces, Aboriginal persons, 2015/16 to 2017/18
- Injury due to exposure to animate mechanical forces, Aboriginal persons, 2015/16 to 2017/18
- Intentional self-harm, Aboriginal persons, 2015/16 to 2017/18
- Assault, Aboriginal persons, 2015/16 to 2017/18
- Other diagnosis of injury or poisoning, by external cause, Aboriginal persons, 2015/16 to 2017/18
- All diagnosis of injury or poisoning, by external cause, Aboriginal persons, 2015/16 to 2017/18
Same-day admissions for renal dialysis
- Same-day dialysis for kidney disease, Aboriginal persons, 2015/16 to 2017/18
Potentially preventable hospitalisations - by broad age group
- Potentially preventable conditions by broad age groups: Aboriginal persons aged 0-14, 15-24, 25-44, 45-64, 65+, and 15+, 2015/16 to 2017/18
- All potentially preventable conditions, Aboriginal persons, 2015/16 to 2017/18
Potentially preventable hospitalisations - Vaccine-preventable conditions
- Vaccine-preventable conditions - pneumonia and influenza, Aboriginal persons, 2015/16 to 2017/18
- Vaccine-preventable conditions - other, Aboriginal persons, 2015/16 to 2017/18
- Total vaccine-preventable conditions, Aboriginal persons, 2015/16 to 2017/18
Potentially preventable hospitalisations - Acute conditions
- Acute cellulitis, Aboriginal persons, 2015/16 to 2017/18
- Acute convulsions and epilepsy, Aboriginal persons, 2015/16 to 2017/18
- Acute dental conditions, Aboriginal persons, 2015/16 to 2017/18
- Acute ear, nose and throat infections, Aboriginal persons, 2015/16 to 2017/18
- Acute urinary tract infections, including pyelonephritis, Aboriginal persons, 2015/16 to 2017/18
- Other acute conditions, Aboriginal persons, 2015/16 to 2017/18
- Total acute conditions, Aboriginal persons, 2015/16 to 2017/18
Potentially preventable hospitalisations - Chronic conditions
- Chronic angina, Aboriginal persons, 2015/16 to 2017/18
- Chronic asthma, Aboriginal persons, 2015/16 to 2017/18
- Chronic congestive cardiac failure, Aboriginal persons, 2015/16 to 2017/18
- Chronic Obstructive Pulmonary Disease (COPD), Aboriginal persons, 2015/16 to 2017/18
- Chronic diabetes complications, Aboriginal persons, 2015/16 to 2017/18
- Chronic iron deficiency anaemia, Aboriginal persons, 2015/16 to 2017/18
- Other chronic conditions, Aboriginal persons, 2015/16 to 2017/18
- Total chronic conditions, Aboriginal persons, 2015/16 to 2017/18
Emergency department presentations, total - by triage category
- Resuscitation and emergency presentations - Total, Aboriginal persons, 2017/18
- Urgent presentations - Total, Aboriginal persons, 2017/18
- Semi-urgent presentations - Total, Aboriginal persons, 2017/18
- Non-urgent presentations - Total, Aboriginal persons, 2017/18
Emergency department presentations, total - by principal diagnosis
- Total presentations, Aboriginal persons, 2017/18
- Total presentations for certain infectious and parasitic diseases, Aboriginal persons, 2017/18
- Total presentations for mental and behavioural disorders, Aboriginal persons, 2017/18
- Total presentations for diseases of the circulatory system, Aboriginal persons, 2017/18
- Total presentations for diseases of the respiratory system, Aboriginal persons, 2017/18
- Total presentations for diseases of the digestive system, Aboriginal persons, 2017/18
- Total presentations for diseases of the musculoskeletal system and connective tissue, Aboriginal persons, 2017/18
- Total presentations for diseases of the genitourinary system, Aboriginal persons, 2017/18
- Total presentations for injury, poisoning and certain other consequences of external causes, Aboriginal persons, 2017/18
- Total presentations for factors influencing health status and contact with health services, Aboriginal persons, 2017/18
- Total presentations for other diseases/ conditions, Aboriginal persons, 2017/18
Emergency department presentations, resuscitation and emergency - by principal diagnosis
- Resuscitation and emergency presentations - Total, Aboriginal persons, 2017/18
- Resuscitation and emergency presentations for diseases of the respiratory system, Aboriginal persons, 2017/18
- Resuscitation and emergency presentations for injury, poisoning and certain other consequences of external causes, Aboriginal persons, 2017/18
- Resuscitation and emergency presentations for other diseases/ conditions, Aboriginal persons, Aboriginal persons, 2017/18
Emergency department presentations, urgent - by principal diagnosis
- Urgent presentations - Total, Aboriginal persons, 2017/18
- Urgent presentations for diseases of the respiratory system, Aboriginal persons, 2017/18
- Urgent presentations for injury, poisoning and certain other consequences of external causes, Aboriginal persons, 2017/18
- Urgent presentations for other diseases/ conditions, Aboriginal persons, 2017/18
Emergency department presentations, resuscitation, emergency and urgent - by principal diagnosis
- Resuscitation, emergency and urgent presentations for certain infectious and parasitic diseases, Aboriginal persons, 2017/18
- Resuscitation, emergency and urgent presentations for mental and behavioural disorders, Aboriginal persons, 2017/18
- Resuscitation, emergency and urgent presentations for diseases of the digestive system, Aboriginal persons, 2017/18
- Resuscitation, emergency and urgent presentations for diseases of the musculoskeletal system and connective tissue, Aboriginal persons, 2017/18
- Resuscitation, emergency and urgent presentations for diseases of the genitourinary system, Aboriginal persons, 2017/18
- Resuscitation, emergency and urgent presentations for factors influencing health status and contact with health services, Aboriginal persons, 2017/18
Emergency department presentations, semi-urgent - by principal diagnosis
- Semi-urgent presentations - Total, Aboriginal persons, 2017/18
- Semi-urgent presentations for injury, poisoning and certain other consequences of external causes, Aboriginal persons, 2017/18
- Semi-urgent presentations for factors influencing health status and contact with health services, Aboriginal persons, 2017/18
- Semi-urgent presentations for other diseases/ conditions, Aboriginal persons, 2017/18
Emergency department presentations, non-urgent - by principal diagnosis
- Non-urgent presentations - Total, Aboriginal persons, 2017/18
- Non-urgent presentations for injury, poisoning and certain other consequences of external causes, Aboriginal persons, 2017/18
- Non-urgent presentations for factors influencing health status and contact with health services, Aboriginal persons, 2017/18
- Non-urgent presentations for other diseases/ conditions, Aboriginal persons, 2017/18
Emergency department presentations, semi-urgent and non-urgent - by principal diagnosis
- Semi-urgent and non-urgent presentations for certain infectious and parasitic diseases, Aboriginal persons, 2017/18
- Semi-urgent and non-urgent presentations for mental and behavioural disorders, Aboriginal persons, 2017/18
- Semi-urgent and non-urgent presentations for diseases of the respiratory system, Aboriginal persons, 2017/18
- Semi-urgent and non-urgent presentations for diseases of the digestive system, Aboriginal persons, 2017/18
- Semi-urgent and non-urgent presentations for diseases of the musculoskeletal system and connective tissue, Aboriginal persons, 2017/18
- Semi-urgent and non-urgent presentations for diseases of the genitourinary system, 2017/18
Click hereto access the maps for these atlases.
Click hereto access the data for these atlases.
Data release: 30 June 2020
Data release: By quintile of socioeconomic disadvantage of area within Primary Health Networks (PHNs)
The topics and indicators from the Social Health Atlas of Australia have now been released by quintile of socioeconomic disadvantage of area within Primary Health Networks (PHNs).
Click hereto access the graphs.
Click hereto access the data.
Data release: By Population Health Area, Local Government Area, Primary Health Network
Social Health Atlases of Australia
The topics and indicators in this latest release are listed below. Click the matrix table below to view the data and the format by which they are published.
Fertility
- Total fertility rate, 2015 to 2017
Screening
- Breast screening participation, 2015 and 2016
- Breast screening outcomes - cancer, 2015 and 2016
Admissions by hospital type and sex (excluding same-day admissions for renal dialysis)
- Admissions, males/ females/ persons - Public hospitals, 2017/18
- Admissions, persons - Private hospitals , 2017/18
- Admissions, males/ females/ persons - All hospitals , 2017/18
Admissions by principal diagnosis
- Infectious and parasitic diseases, males/ females/ persons - Public/ All hospitals, 2017/18
- All cancers, males/ females/ persons - Public/ All hospitals, 2017/18
- Endocrine, nutritional and metabolic diseases, males/ females/ persons - Public/ All hospitals, 2017/18
- - Diabetes, males/ females/ persons - Public/ All hospitals, 2017/18
- Mental health-related conditions, males/ females/ persons - Public/ All hospitals, 2017/18
- - Mood affective disorders, males/ females/ persons - Public/ All hospitals, 2017/18
- Nervous system diseases, males/ females/ persons - Public/ All hospitals, 2017/18
- Eye and adnexa diseases, males/ females/ persons - Public/ All hospitals, 2017/18
- Ear and mastoid process diseases, males/ females/ persons - Public/ All hospitals, 2017/18
- Circulatory system diseases, males/ females/ persons - Public/ All hospitals, 2017/18
- - Ischaemic heart disease, males/ females/ persons - Public/ All hospitals, 2017/18
- - Heart failure, males/ females/ persons - Public/ All hospitals, 2017/18
- - Stroke, males/ females/ persons - Public/ All hospitals, 2017/18
- Respiratory system diseases, males/ females/ persons - Public/ All hospitals, 2017/18
- - Asthma, males/ females/ persons - Public/ All hospitals, 2017/18
- - Chronic Obstructive Pulmonary Disease (COPD), males/ females/ persons - Public/ All hospitals, 2017/18
- Digestive system diseases, males/ females/ persons - Public/ All hospitals, 2017/18
- Skin and subcutaneous tissue diseases, males/ females/ persons - Public/ All hospitals, 2017/18
- Musculoskeletal system and connective tissue diseases, males/ females/ persons - Public/ All hospitals, 2017/18
- Genitourinary system diseases, males/ females/ persons - Public/ All hospitals, 2017/18
- - Chronic kidney disease, males/ females/ persons - Public/ All hospitals, 2017/18
- Pregnancy and childbirth 15 to 44 years, females - Public/ All hospitals, 2017/18
- Certain conditions originating in the perinatal period, persons - Public/ All hospitals, 2017/18
- Congenital malformations, deformations and chromosomal abnormalities, males/ females/ persons - Public/ All hospitals, 2017/18
- Injury, poisoning and other external causes, males/ females/ persons - Public/ All hospitals, 2017/18
Admissions by principal diagnosis of injury or poisoning, by external cause
- Transport crash Injury, males/ females/ persons - Public/ All hospitals, 2017/18
- Accidental poisoning, persons - Public/ All hospitals, 2017/18
- Falls, males/ females/ persons - Public/ All hospitals, 2017/18
- Injury due to exposure to inanimate mechanical forces, males/ females/ persons - Public/ All hospitals, 2017/18
- Injury due to exposure to animate mechanical forces, males/ females/ persons - Public/ All hospitals, 2017/18
- Intentional self-harm, males/ females/ persons - Public/ All hospitals, 2017/18
- Assault, males/ females/ persons - Public/ All hospitals, 2017/18
- Other diagnosis of injury or poisoning, by external cause, males/ females/ persons - Public/ All hospitals, 2017/18
- All diagnosis of injury or poisoning, by external cause, males/ females/ persons - Public/ All hospitals, 2017/18
Admissions by procedure
- Tonsillectomy - Public/ Private/ All hospitals, 2017/18
- Myringotomy, 0 to 9 years - Public/ Private/ All hospitals, 2017/18
- Hysterectomy, females aged 30 to 59 years - Public/ Private/ All hospitals, 2017/18
- Caesarean section, females aged 15 to 44 years - Public/ Private/ All hospitals, 2017/18
- Coronary artery bypass graft - Public/ Private/ All hospitals, 2017/18
- Coronary angioplasty - Public/ Private/ All hospitals, 2017/18
- Cardiac catheterisation - Public/ Private/ All hospitals, 2017/18
- Hip fracture - Public/ Private/ All hospitals, 2017/18
- Knee replacement - Public/ Private/ All hospitals, 2017/18
- Knee arthroscopy - Public/ Private/ All hospitals, 2017/18
- Fibre optic colonoscopy - Public/ Private/ All hospitals, 2017/18
- Fibre optic colonoscopy excision - Public/ Private/ All hospitals, 2017/18
Same-day admissions for renal dialysis
- Same-day dialysis for kidney disease - Public/ All hospitals, 2017/18
Potentially preventable hospitalisations - by broad age group
- Potentially preventable conditions by broad age groups: 0-14, 15-24, 25-44, 45-64, 65+, and 15+ - Public/ All hospitals, 2017/18
- All potentially preventable conditions - Public/ All hospitals, 2017/18
Potentially preventable hospitalisations - Vaccine-preventable conditions
- Vaccine-preventable conditions - pneumonia and influenza - Public/ All hospitals, 2017/18
- Vaccine-preventable conditions - other - Public/ All hospitals, 2017/18
- Total vaccine-preventable conditions - Public/ All hospitals, 2017/18
Potentially preventable hospitalisations - Acute conditions
- Acute cellulitis - Public/ All hospitals, 2017/18
- Acute convulsions and epilepsy - Public/ All hospitals, 2017/18
- Acute dental conditions - Public/ All hospitals, 2017/18
- Acute ear, nose and throat infections - Public/ All hospitals, 2017/18
- Acute urinary tract infections, including pyelonephritis - Public/ All hospitals, 2017/18
- Other acute conditions - Public/ All hospitals, 2017/18
- Total acute conditions - Public/ All hospitals, 2017/18
Potentially preventable hospitalisations - Chronic conditions
- Chronic angina - Public/ All hospitals, 2017/18
- Chronic asthma - Public/ All hospitals, 2017/18
- Chronic congestive cardiac failure - Public/ All hospitals, 2017/18
- Chronic Obstructive Pulmonary Disease (COPD) - Public/ All hospitals, 2017/18
- Chronic diabetes complications - Public/ All hospitals, 2017/18
- Chronic iron deficiency anaemia - Public/ All hospitals, 2017/18
- Other chronic conditions - Public/ All hospitals, 2017/18
- Total chronic conditions - Public/ All hospitals, 2017/18
Emergency department presentations, total - by triage category
- Resuscitation presentations - Total
- Emergency presentations - Total
- Urgent presentations - Total
- Semi-urgent presentations - Total
- Non-urgent presentations - Total
Emergency department presentations, total - by principal diagnosis
- Total presentations, 2017/18
- Total presentations for certain infectious and parasitic diseases, 2017/18
- Total presentations for mental and behavioural disorders, 2017/18
- Total presentations for diseases of the circulatory system, 2017/18
- Total presentations for diseases of the respiratory system, 2017/18
- Total presentations for diseases of the digestive system, 2017/18
- Total presentations for diseases of the musculoskeletal system and connective tissue, 2017/18
- Total presentations for diseases of the genitourinary system, 2017/18
- Total presentations for injury, poisoning and certain other consequences of external causes, 2017/18
- Total presentations for factors influencing health status and contact with health services, 2017/18
- Total presentations for other diseases/ conditions, 2017/18
Emergency department presentations, resuscitation - by principal diagnosis
- Resuscitation presentations - Total, 2017/18
- Resuscitation presentations for diseases of the circulatory system, 2017/18
- Resuscitation presentations for diseases of the respiratory system, 2017/18
- Resuscitation presentations for injury, poisoning and certain other consequences of external causes, 2017/18
- Resuscitation presentations for other diseases/ conditions, 2017/18
Emergency department presentations, emergency - by principal diagnosis
- Emergency presentations - Total, 2017/18
- Emergency presentations for diseases of the circulatory system, 2017/18
- Emergency presentations for diseases of the respiratory system, 2017/18
- Emergency presentations for injury, poisoning and certain other consequences of external causes, 2017/18
- Emergency presentations for other diseases/ conditions, 2017/18
Emergency department presentations, resuscitation and emergency - by principal diagnosis
- Resuscitation and emergency presentations for certain infectious and parasitic diseases, 2017/18
- Resuscitation and emergency presentations for mental and behavioural disorders, 2017/18
- Resuscitation and emergency presentations for diseases of the digestive system, 2017/18
- Resuscitation and emergency presentations for diseases of the musculoskeletal system and connective tissue, 2017/18
- Resuscitation and emergency presentations for diseases of the genitourinary system, 2017/18
- Resuscitation and emergency presentations for factors influencing health status and contact with health services, 2017/18
Emergency department presentations, urgent - by principal diagnosis
- Urgent presentations - Total, 2017/18
- Urgent presentations for certain infectious and parasitic diseases, 2017/18
- Urgent presentations for mental and behavioural disorders, 2017/18
- Urgent presentations for diseases of the circulatory system, 2017/18
- Urgent presentations for diseases of the respiratory system, 2017/18
- Urgent presentations for diseases of the digestive system, 2017/18
- Urgent presentations for diseases of the musculoskeletal system and connective tissue, 2017/18
- Urgent presentations for diseases of the genitourinary system, 2017/18
- Urgent presentations for injury, poisoning and certain other consequences of external causes, 2017/18
- Urgent presentations for factors influencing health status and contact with health services, 2017/18
- Urgent presentations for other diseases/ conditions, 2017/18
Emergency department presentations, semi-urgent - by principal diagnosis
- Semi-urgent presentations - Total, 2017/18
- Semi-urgent presentations for certain infectious and parasitic diseases, 2017/18
- Semi-urgent presentations for mental and behavioural disorders, 2017/18
- Semi-urgent presentations for diseases of the circulatory system, 2017/18
- Semi-urgent presentations for diseases of the respiratory system, 2017/18
- Semi-urgent presentations for diseases of the digestive system, 2017/18
- Semi-urgent presentations for diseases of the musculoskeletal system and connective tissue, 2017/18
- Semi-urgent presentations for diseases of the genitourinary system, 2017/18
- Semi-urgent presentations for injury, poisoning and certain other consequences of external causes, 2017/18
- Semi-urgent presentations for factors influencing health status and contact with health services, 2017/18
- Semi-urgent presentations for other diseases/ conditions, 2017/18
Emergency department presentations, non-urgent - by principal diagnosis
- Non-urgent presentations - Total, 2017/18
- Non-urgent presentations for certain infectious and parasitic diseases, 2017/18
- Non-urgent presentations for mental and behavioural disorders, 2017/18
- Non-urgent presentations for diseases of the circulatory system, 2017/18
- Non-urgent presentations for diseases of the respiratory system, 2017/18
- Non-urgent presentations for diseases of the digestive system, 2017/18
- Non-urgent presentations for diseases of the musculoskeletal system and connective tissue, 2017/18
- Non-urgent presentations for diseases of the genitourinary system, 2017/18
- Non-urgent presentations for injury, poisoning and certain other consequences of external causes, 2017/18
- Non-urgent presentations for factors influencing health status and contact with health services, 2017/18
- Non-urgent presentations for other diseases/ conditions, 2017/18
Click hereto access the maps for these atlases.
Click hereto access the data for these atlases.
Data release: By quintile of socioeconomic disadvantage of area and Remoteness Area
Social Health Atlases of Australia
The topics and indicators in this latest release are listed below. Click the matrix table below to view the data and the format by which they are published.
Fertility
- Total fertility rate, 2015 to 2017
Screening
- Breast screening participation, 2015 and 2016
- Breast screening outcomes - cancer, 2015 and 2016
Admissions by hospital type and sex (excluding same-day admissions for renal dialysis)
- Admissions, males/ females/ persons - Public hospitals, 2017/18
- Admissions, persons - Private hospitals, 2017/18
- Admissions, males/ females/ persons - All hospitals, 2017/18
Admissions by principal diagnosis
- Infectious and parasitic diseases, males/ females/ persons - Public/ All hospitals, 2017/18
- All cancers, males/ females/ persons - Public/ All hospitals, 2017/18
- Endocrine, nutritional and metabolic diseases, males/ females/ persons - Public/ All hospitals, 2017/18
- - Diabetes, males/ females/ persons - Public/ All hospitals, 2017/18
- Mental health-related conditions, males/ females/ persons - Public/ All hospitals, 2017/18
- - Mood affective disorders, males/ females/ persons - Public/ All hospitals, 2017/18
- Nervous system diseases, males/ females/ persons - Public/ All hospitals, 2017/18
- Eye and adnexa diseases, males/ females/ persons - Public/ All hospitals, 2017/18
- Ear and mastoid process diseases, males/ females/ persons - Public/ All hospitals, 2017/18
- Circulatory system diseases, males/ females/ persons - Public/ All hospitals, 2017/18
- - Ischaemic heart disease, males/ females/ persons - Public/ All hospitals, 2017/18
- - Heart failure, males/ females/ persons - Public/ All hospitals, 2017/18
- - Stroke, males/ females/ persons - Public/ All hospitals, 2017/18
- Respiratory system diseases, males/ females/ persons - Public/ All hospitals, 2017/18
- - Asthma, males/ females/ persons - Public/ All hospitals, 2017/18
- - Chronic Obstructive Pulmonary Disease (COPD), males/ females/ persons - Public/ All hospitals, 2017/18
- Digestive system diseases, males/ females/ persons - Public/ All hospitals, 2017/18
- Skin and subcutaneous tissue diseases, males/ females/ persons - Public/ All hospitals, 2017/18
- Musculoskeletal system and connective tissue diseases, males/ females/ persons - Public/ All hospitals, 2017/18
- Genitourinary system diseases, males/ females/ persons - Public/ All hospitals, 2017/18
- - Chronic kidney disease, males/ females/ persons - Public/ All hospitals, 2017/18
- Pregnancy and childbirth 15 to 44 years, females - Public/ All hospitals, 2017/18
- Certain conditions originating in the perinatal period, persons - Public/ All hospitals, 2017/18
- Congenital malformations, deformations and chromosomal abnormalities, males/ females/ persons - Public/ All hospitals, 2017/18
- Injury, poisoning and other external causes, males/ females/ persons - Public/ All hospitals, 2017/18
Admissions by principal diagnosis of injury or poisoning, by external cause
- Transport crash Injury, males/ females/ persons - Public/ All hospitals, 2017/18
- Accidental poisoning, persons - Public/ All hospitals, 2017/18
- Falls, males/ females/ persons - Public/ All hospitals, 2017/18
- Injury due to exposure to inanimate mechanical forces, males/ females/ persons - Public/ All hospitals, 2017/18
- Injury due to exposure to animate mechanical forces, males/ females/ persons - Public/ All hospitals, 2017/18
- Intentional self-harm, males/ females/ persons - Public/ All hospitals, 2017/18
- Assault, males/ females/ persons - Public/ All hospitals, 2017/18
- Other diagnosis of injury or poisoning, by external cause, males/ females/ persons - Public/ All hospitals, 2017/18
- All diagnosis of injury or poisoning, by external cause, males/ females/ persons - Public/ All hospitals, 2017/18
Admissions by procedure
- Tonsillectomy - Public/ All hospitals, 2017/18
- Myringotomy, 0 to 9 years - Public/ All hospitals, 2017/18
- Hysterectomy, females aged 30 to 59 years - Public/ All hospitals, 2017/18
- Caesarean section, females aged 15 to 44 years - Public/ All hospitals, 2017/18
- Coronary artery bypass graft - Public/ All hospitals, 2017/18
- Coronary angioplasty - Public/ All hospitals, 2017/18
- Cardiac catheterisation - Public/ All hospitals, 2017/18
- Hip fracture - Public/ All hospitals, 2017/18
- Knee replacement - Public/ All hospitals, 2017/18
- Knee arthroscopy - Public/ All hospitals, 2017/18
- Fibre optic colonoscopy - Public/ All hospitals, 2017/18
- Fibre optic colonoscopy excision - Public/ All hospitals, 2017/18
Same-day admissions for renal dialysis
- Same-day dialysis for kidney disease - Public/ All hospitals, 2017/18
Potentially preventable hospitalisations - by broad age group
- Potentially preventable conditions by broad age groups: 0-14, 15-24, 25-44, 45-64, 65+, and 15+ - Public/ All hospitals, 2017/18
- All potentially preventable conditions - Public/ All hospitals, 2017/18
Potentially preventable hospitalisations - Vaccine-preventable conditions
- Vaccine-preventable conditions - pneumonia and influenza - Public/ All hospitals, 2017/18
- Vaccine-preventable conditions - other - Public/ All hospitals, 2017/18
- Total vaccine-preventable conditions - Public/ All hospitals, 2017/18
Potentially preventable hospitalisations - Acute conditions
- Acute cellulitis - Public/ All hospitals, 2017/18
- Acute convulsions and epilepsy - Public/ All hospitals, 2017/18
- Acute dental conditions - Public/ All hospitals, 2017/18
- Acute ear, nose and throat infections - Public/ All hospitals, 2017/18
- Acute urinary tract infections, including pyelonephritis - Public/ All hospitals, 2017/18
- Other acute conditions - Public/ All hospitals, 2017/18
- Total acute conditions - Public/ All hospitals, 2017/18
Potentially preventable hospitalisations - Chronic conditions
- Chronic angina - Public/ All hospitals, 2017/18
- Chronic asthma - Public/ All hospitals, 2017/18
- Chronic congestive cardiac failure - Public/ All hospitals, 2017/18
- Chronic Obstructive Pulmonary Disease (COPD) - Public/ All hospitals, 2017/18
- Chronic diabetes complications - Public/ All hospitals, 2017/18
- Chronic iron deficiency anaemia - Public/ All hospitals, 2017/18
- Other chronic conditions - Public/ All hospitals, 2017/18
- Total chronic conditions - Public/ All hospitals, 2017/18
Emergency department presentations , total - by triage category
- Resuscitation presentations - Total
- Emergency presentations - Total
- Urgent presentations - Total
- Semi-urgent presentations - Total
- Non-urgent presentations - Total
Emergency department presentations, total - by principal diagnosis
- Total presentations, 2017/18
- Total presentations for certain infectious and parasitic diseases, 2017/18
- Total presentations for mental and behavioural disorders, 2017/18
- Total presentations for diseases of the circulatory system, 2017/18
- Total presentations for diseases of the respiratory system, 2017/18
- Total presentations for diseases of the digestive system, 2017/18
- Total presentations for diseases of the musculoskeletal system and connective tissue, 2017/18
- Total presentations for diseases of the genitourinary system, 2017/18
- Total presentations for injury, poisoning and certain other consequences of external causes, 2017/18
- Total presentations for factors influencing health status and contact with health services, 2017/18
- Total presentations for other diseases/ conditions, 2017/18
Emergency department presentations, resuscitation - by principal diagnosis
- Resuscitation presentations - Total, 2017/18
- Resuscitation presentations for diseases of the circulatory system, 2017/18
- Resuscitation presentations for diseases of the respiratory system, 2017/18
- Resuscitation presentations for injury, poisoning and certain other consequences of external causes, 2017/18
- Resuscitation presentations for other diseases/ conditions, 2017/18
Emergency department presentations, emergency - by principal diagnosis
- Emergency presentations - Total, 2017/18
- Emergency presentations for diseases of the circulatory system, 2017/18
- Emergency presentations for diseases of the respiratory system, 2017/18
- Emergency presentations for injury, poisoning and certain other consequences of external causes, 2017/18
- Emergency presentations for other diseases/ conditions, 2017/18
Emergency department presentations, resuscitation and emergency - by principal diagnosis
- Resuscitation and emergency presentations for certain infectious and parasitic diseases, 2017/18
- Resuscitation and emergency presentations for mental and behavioural disorders, 2017/18
- Resuscitation and emergency presentations for diseases of the digestive system, 2017/18
- Resuscitation and emergency presentations for diseases of the musculoskeletal system and connective tissue, 2017/18
- Resuscitation and emergency presentations for diseases of the genitourinary system, 2017/18
- Resuscitation and emergency presentations for factors influencing health status and contact with health services, 2017/18
Emergency department presentations, urgent - by principal diagnosis
- Urgent presentations - Total, 2017/18
- Urgent presentations for certain infectious and parasitic diseases, 2017/18
- Urgent presentations for mental and behavioural disorders, 2017/18
- Urgent presentations for diseases of the circulatory system, 2017/18
- Urgent presentations for diseases of the respiratory system, 2017/18
- Urgent presentations for diseases of the digestive system, 2017/18
- Urgent presentations for diseases of the musculoskeletal system and connective tissue, 2017/18
- Urgent presentations for diseases of the genitourinary system, 2017/18
- Urgent presentations for injury, poisoning and certain other consequences of external causes, 2017/18
- Urgent presentations for factors influencing health status and contact with health services, 2017/18
- Urgent presentations for other diseases/ conditions, 2017/18
Emergency department presentations, semi-urgent - by principal diagnosis
- Semi-urgent presentations - Total, 2017/18
- Semi-urgent presentations for certain infectious and parasitic diseases, 2017/18
- Semi-urgent presentations for mental and behavioural disorders, 2017/18
- Semi-urgent presentations for diseases of the circulatory system, 2017/18
- Semi-urgent presentations for diseases of the respiratory system, 2017/18
- Semi-urgent presentations for diseases of the digestive system, 2017/18
- Semi-urgent presentations for diseases of the musculoskeletal system and connective tissue, 2017/18
- Semi-urgent presentations for diseases of the genitourinary system, 2017/18
- Semi-urgent presentations for injury, poisoning and certain other consequences of external causes, 2017/18
- Semi-urgent presentations for factors influencing health status and contact with health services, 2017/18
- Semi-urgent presentations for other diseases/ conditions, 2017/18
Emergency department presentations, non-urgent - by principal diagnosis
- Non-urgent presentations - Total, 2017/18
- Non-urgent presentations for certain infectious and parasitic diseases, 2017/18
- Non-urgent presentations for mental and behavioural disorders, 2017/18
- Non-urgent presentations for diseases of the circulatory system, 2017/18
- Non-urgent presentations for diseases of the respiratory system, 2017/18
- Non-urgent presentations for diseases of the digestive system, 2017/18
- Non-urgent presentations for diseases of the musculoskeletal system and connective tissue, 2017/18
- Non-urgent presentations for diseases of the genitourinary system, 2017/18
- Non-urgent presentations for injury, poisoning and certain other consequences of external causes, 2017/18
- Non-urgent presentations for factors influencing health status and contact with health services, 2017/18
- Non-urgent presentations for other diseases/ conditions, 2017/18
Click hereto access the graphs.
Click hereto access the data.
Data release: By quintile of socioeconomic disadvantage of area time series and Remoteness Area time series
Social Health Atlases of Australia
The topics and indicators in this latest release are listed below. Click the matrix table below to view the data and the format by which they are published.
Fertility
- Total fertility rate, 2004 to 2006 and 2015 to 2017
Admissions by hospital type and sex (excluding same-day admissions for renal dialysis)
- Admissions, males/ females/ persons - Public hospitals, various time periods
- Admissions, persons - Private hospitals, various time periods
- Admissions, males/ females/total - All hospitals, various time periods
Admissions by principal diagnosis
- Infectious and parasitic diseases, males/ females/ persons - Public/ All hospitals, various time periods
- All cancers, males/ females/ persons - Public/ All hospitals, various time periods
- Endocrine, nutritional and metabolic diseases, males/ females/ persons - Public/ All hospitals, various time periods
- Mental health-related conditions, males/ females/ persons - Public/ All hospitals, various time periods
- Nervous system diseases, males/ females/ persons - Public/ All hospitals, various time periods
- Eye and adnexa diseases, males/ females/ persons - Public/ All hospitals, various time periods
- Ear and mastoid process diseases, males/ females/ persons - Public/ All hospitals, various time periods
- Circulatory system diseases, males/ females/ persons - Public/ All hospitals, various time periods
- Respiratory system diseases, males/ females/ persons - Public/ All hospitals, various time periods
- Digestive system diseases, males/ females/ persons - Public/ All hospitals, various time periods
- Skin and subcutaneous tissue diseases, males/ females/ persons - Public/ All hospitals, various time periods
- Musculoskeletal system and connective tissue diseases, males/ females/ persons - Public/ All hospitals, various time periods
- Genitourinary system diseases, males/ females/ persons - Public/ All hospitals, various time periods
- Pregnancy and childbirth 15 to 44 years, females - Public/ All hospitals, various time periods
- Certain conditions originating in the perinatal period, persons - Public/ All hospitals, various time periods
- Congenital malformations, deformations and chromosomal abnormalities, males/ females/ persons - Public/ All hospitals, various time periods
- Injury, poisoning and other external causes, males/ females/ persons - Public/ All hospitals, various time periods
Admissions by procedure
- Tonsillectomy - Public/ Private/ All hospitals, various time periods
- Myringotomy, 0 to 9 years - Public/ Private/ All hospitals, various time periods
- Hysterectomy, females aged 30 to 59 years - Public/ Private/ All hospitals, various time periods
- Caesarean section, females aged 15 to 44 years - Public/ Private/ All hospitals, various time periods
- Coronary artery bypass graft - Public/ Private/ All hospitals, various time periods
- Coronary angioplasty - Public/ Private/ All hospitals, various time periods
- Cardiac catheterisation - Public/ Private/ All hospitals, various time periods
- Hip fracture - Public/ Private/ All hospitals, various time periods
- Knee replacement - Public/ Private/ All hospitals, various time periods
- Knee arthroscopy - Public/ Private/ All hospitals, various time periods
- Fibre optic colonoscopy - Public/ Private/ All hospitals, various time periods
- Fibre optic colonoscopy excision - Public/ Private/ All hospitals, various time periods
Same-day admissions for renal dialysis
- Same-day dialysis for kidney disease - Public/ All hospitals, various time periods
Potentially preventable hospitalisations
- All potentially preventable conditions - Public/ All hospitals, various time periods
Potentially preventable hospitalisations - Vaccine-preventable conditions
- Vaccine-preventable conditions - pneumonia and influenza - Public/ All hospitals, various time periods
- Vaccine-preventable conditions - other - Public/ All hospitals, various time periods
- Total vaccine-preventable conditions - Public/ All hospitals, various time periods
Potentially preventable hospitalisations - Acute conditions
- Acute cellulitis - Public/ All hospitals, various time periods
- Acute convulsions and epilepsy - Public/ All hospitals, various time periods
- Acute dental conditions - Public/ All hospitals, various time periods
- Acute ear, nose and throat infections - Public/ All hospitals, various time periods
- Acute urinary tract infections, including pyelonephritis - Public/ All hospitals, various time periods
- Other acute conditions - Public/ All hospitals, various time periods
- Total acute conditions - Public/ All hospitals, various time periods
Potentially preventable hospitalisations - Chronic conditions
- Chronic angina - Public/ All hospitals, various time periods
- Chronic asthma - Public/ All hospitals, various time periods
- Chronic congestive cardiac failure - Public/ All hospitals, various time periods
- Chronic Obstructive Pulmonary Disease (COPD) - Public/ All hospitals, various time periods
- Chronic diabetes complications - Public/ All hospitals, various time periods
- Chronic iron deficiency anaemia - Public/ All hospitals, various time periods
- Other chronic conditions - Public/ All hospitals, various time periods
- Total chronic conditions - Public/ All hospitals, various time periods
Emergency department presentations - Total
- Total presentations, 2012/12 and 2017/18
Click hereto access the graphs.
Click hereto access the data.
Data release: 16 June 2020
Data release: By Population Health Area, Local Government Area, Primary Health Network
Social Health Atlases of Australia
The topics and indicators in this latest release are listed below. Click the matrix table below to view the data and the format by which they are published.
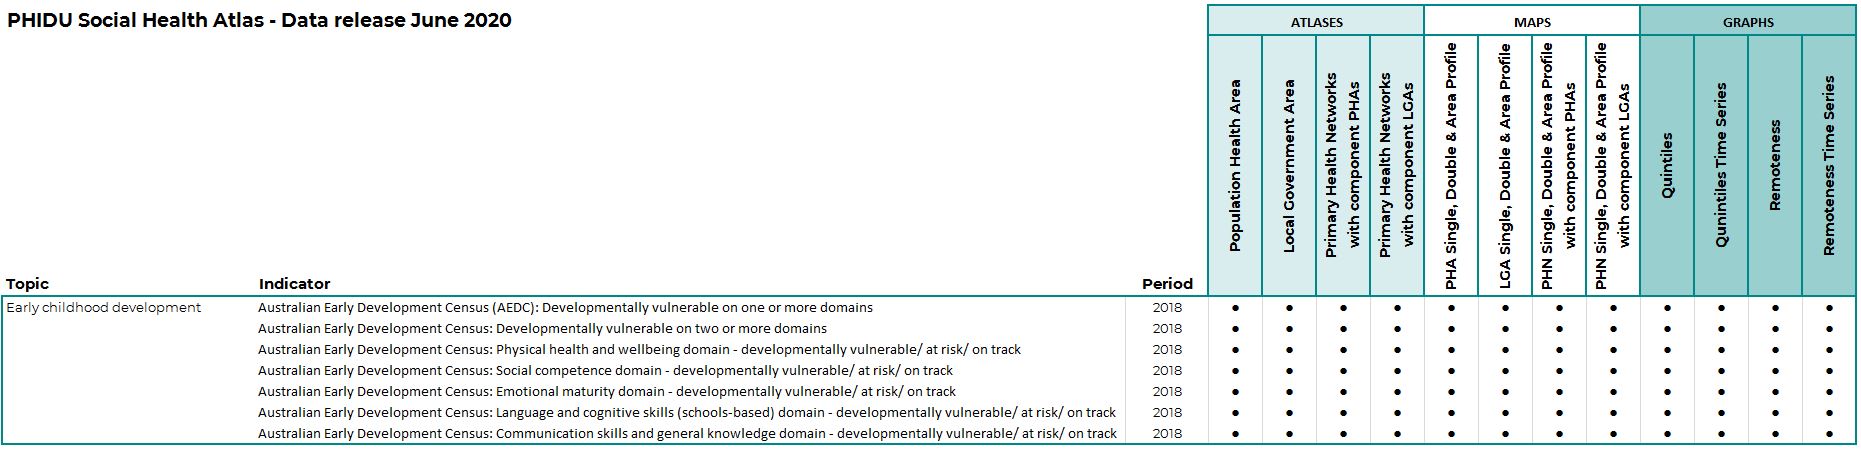
Early childhood development
- Australian Early Development Census (AEDC): Developmentally vulnerable on one or more domains, 2018
- Australian Early Development Census: Developmentally vulnerable on two or more domains, 2018
- Australian Early Development Census: Physical health and wellbeing domain - developmentally vulnerable/ at risk/ on track, 2018
- Australian Early Development Census: Social competence domain - developmentally vulnerable/ at risk/ on track, 2018
- Australian Early Development Census: Emotional maturity domain - developmentally vulnerable/ at risk/ on track, 2018
- Australian Early Development Census: Language and cognitive skills (school-based) domain - developmentally vulnerable/ at risk/ on track, 2018
- Australian Early Development Census: Communication skills and general knowledge domain - developmentally vulnerable/ at risk/ on track, 2018
Data release: By quintile of socioeconomic disadvantage of area and Remoteness Area
Social Health Atlases of Australia
The topics and indicators in this latest release are listed below. Click the matrix table below to view the data and the format by which they are published.
Early childhood development
- Australian Early Development Census (AEDC): Developmentally vulnerable on one or more domains, 2018
- Australian Early Development Census: Developmentally vulnerable on two or more domains, 2018
- Australian Early Development Census: Physical health and wellbeing domain - developmentally vulnerable/ at risk/ on track, 2018
- Australian Early Development Census: Social competence domain - developmentally vulnerable/ at risk/ on track, 2018
- Australian Early Development Census: Emotional maturity domain - developmentally vulnerable/ at risk/ on track, 2018
- Australian Early Development Census: Language and cognitive skills (school-based) domain - developmentally vulnerable/ at risk/ on track, 2018
- Australian Early Development Census: Communication skills and general knowledge domain - developmentally vulnerable/ at risk/ on track, 2018
Data release: By quintile of socioeconomic disadvantage of area time series and Remoteness Area time series
Social Health Atlases of Australia
The topics and indicators in this latest release are listed below. Click the matrix table below to view the data and the format by which they are published.
Early childhood development
- Australian Early Development Census (AEDC): Developmentally vulnerable on one or more domains, 2018
- Australian Early Development Census: Developmentally vulnerable on two or more domains, 2018
- Australian Early Development Census: Physical health and wellbeing domain - developmentally vulnerable/ at risk/ on track, 2018
- Australian Early Development Census: Social competence domain - developmentally vulnerable/ at risk/ on track, 2018
- Australian Early Development Census: Emotional maturity domain - developmentally vulnerable/ at risk/ on track, 2018
- Australian Early Development Census: Language and cognitive skills (school-based) domain - developmentally vulnerable/ at risk/ on track, 2018
- Australian Early Development Census: Communication skills and general knowledge domain - developmentally vulnerable/ at risk/ on track, 2018
Data release: By Indigenous Area
Aboriginal & Torres Strait Islander Social Health Atlases of Australia
The topics and indicators in this latest release are listed below. Click the matrix table below to view the data and the format by which they are published.
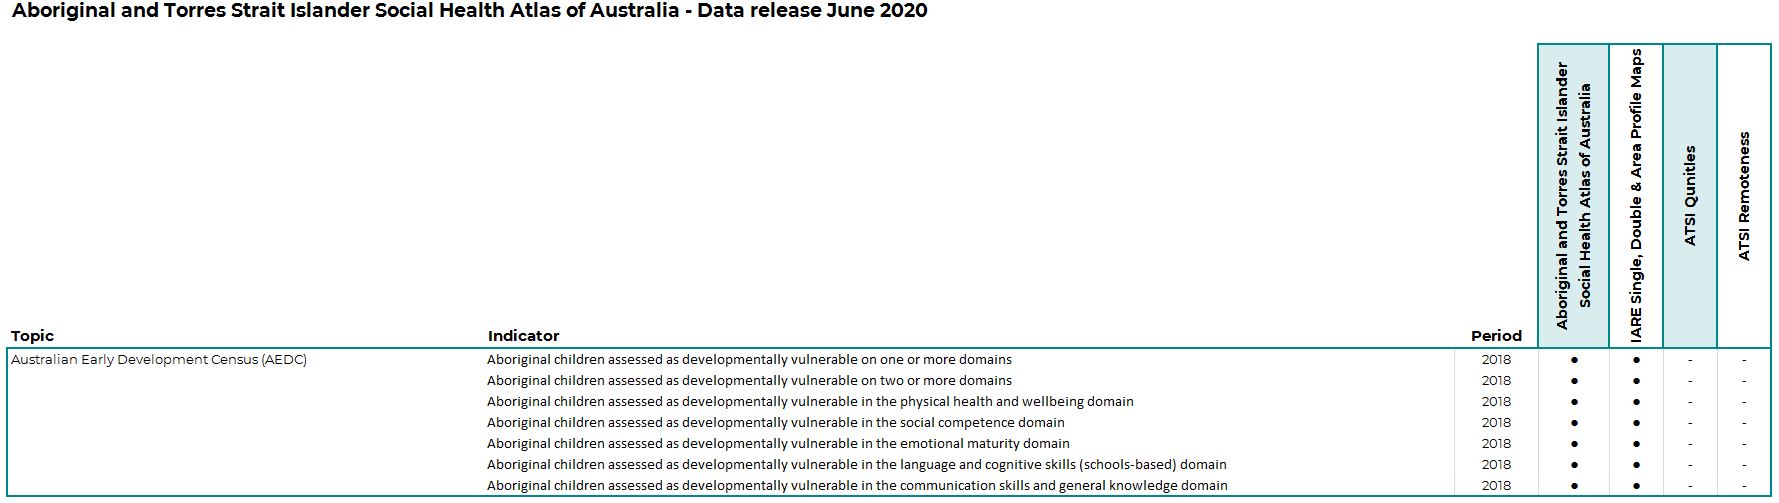
Australian Early Development Census (AEDC)
- Aboriginal children assessed as developmentally vulnerable on one or more domains, 2018
- Aboriginal children assessed as developmentally vulnerable on two or more domains, 2018
- Aboriginal children assessed as developmentally vulnerable in the physical health and wellbeing domain, 2018
- Aboriginal children assessed as developmentally vulnerable in the social competence domain, 2018
- Aboriginal children assessed as developmentally vulnerable in the emotional maturity domain, 2018
- Aboriginal children assessed as developmentally vulnerable in the language and cognitive skills (school-based) domain, 2018
- Aboriginal children assessed as developmentally vulnerable in the communication skills and general knowledge domain, 2018
Data release: 28 May 2020
Data release: Aboriginal & Torres Strait Islander data by Primary Health Network including component IAREs
The topics and indicators from the Aboriginal & Torres Strait Islander Social Health Atlas of Australia have now been released by Primary Health Networks (including component Indigenous Areas).
Click hereto access the maps for this atlas.
Click hereto access the data for this atlas.
Data release: Topic-Specific Atlases - Indigenous Status Comparison: Social Health Atlas of Australia
Indigenous Status Comparison: Social Health Atlas of Australia
The Indigenous Status Comparison: Social Health Atlas of Australia, presents selected topics and compares indicators between Indigenous and Non-Indigenous populations in Australia. This is available by Indigenous Areas, including total for the Greater Capital City Statistical Areas/Rest of States/NT; and States/Territories.
The topics and indicators in this latest release are listed below.
Updated
- Male, female and person estimated resident population, 2016
- Vocational education and training, 2017
- Immunisation, 2018
- Premature deaths by age, sex and cause, 2013-17
Added
- Preschool, 2016
- Persons in social housing rented dwellings, 2016
- Persons in dwellings rented in the private rental market, 2016
- Social housing rented dwellings , 2016
- Privately rented dwellings, 2016
- Crowded dwellings, 2016
- Severely crowded dwellings, 2016
- Median age at death, 2013-17
- Avoidable mortality by sex and cause, 2013-17
- Years of life lost, 2013-17
Click hereto access the maps for this atlas.
Click hereto access the data for this atlas.
Data release: 28 February 2020
Data release: By Population Health Area, Local Government Area, Primary Health Network; and amendment
Social Health Atlases of Australia
The topics and indicators in this latest release are listed below. Click the matrix table below to view the data and the format by which they are published.
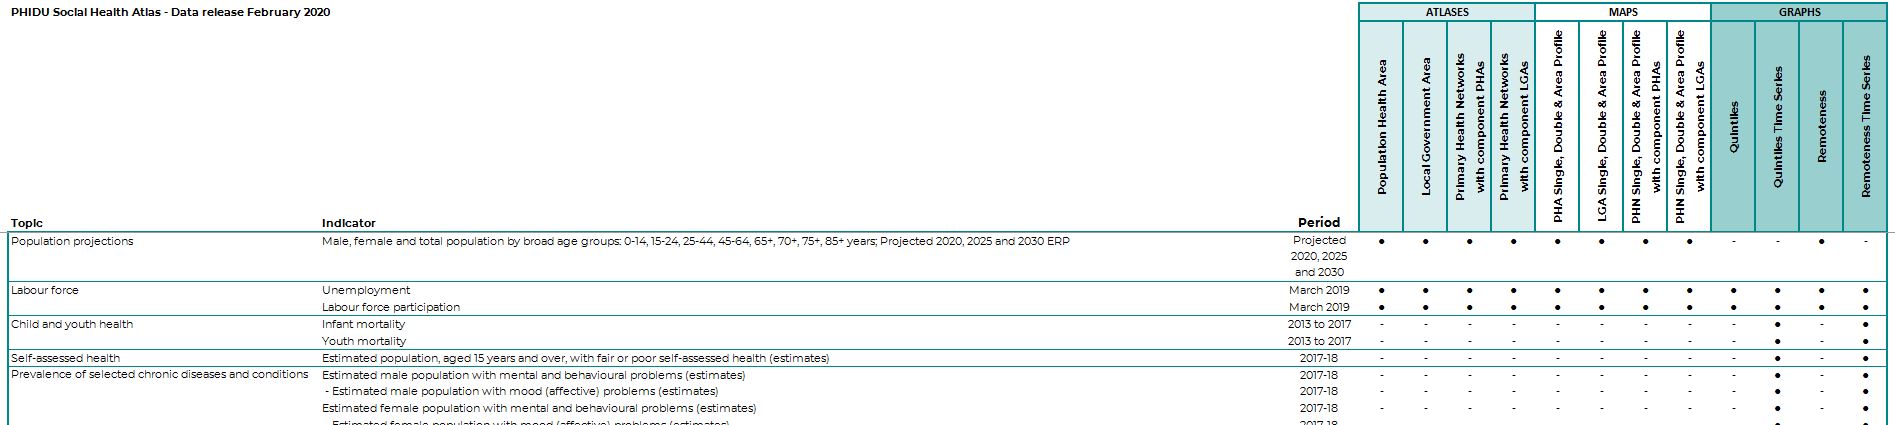
Population projections
- Male, female and total population by broad age groups: 0-14, 15-24, 25-44, 45-64, 65+, 70+, 75+, 85+ years; Projected 2020, 2025 and 2030 ERP
Labour force
- Unemployment, March 2019
- Labour force participation, March 2019
Potential years of life lost
- Potential years of life lost, males, females and persons, 2013 to 2017
Hospital admissions, and same-day admissions for dialysis for kidney disease - amendment
WA Health have advised that same-day dialysis activity in WA which was contracted to private facilities, but funded by public hospitals, has been double-counted in data published for recent years. The data items affected are:
- Male total admissions (excluding same-day admissions for renal dialysis) - Public and All hospitals
- Female total admissions (excluding same-day admissions for renal dialysis) - Public and All hospitals
- Total admissions (excluding same-day admissions for renal dialysis) - Public and All hospitals
- Same-day admissions for dialysis for kidney disease - Public and All hospitals
Cervical screening - amendment
Incorrect data for Victoria were identified in the previous release.
- Cervical screening participation, females aged 20 to 69 years, 2015 and 2016
- Cervical screening outcomes - Low grade abnormality, females aged 20 to 69 years, 2015 and 2016
- Cervical screening outcomes - High grade abnormality, females aged 20 to 69 years, 2015 and 2016
Data release: By quintile of socioeconomic disadvantage of area and Remoteness Area; and amendment
Social Health Atlases of Australia
The topics and indicators in this latest release are listed below. Click the matrix table below to view the data and the format by which they are published.
Population projections
- Male, female and total population by broad age groups: 0-14, 15-24, 25-44, 45-64, 65+, 70+, 75+, 85+ years; Projected 2020, 2025 and 2030 ERP (Remoteness Area only)
Labour force
- Unemployment, March 2019
- Labour force participation, March 2019
Potential years of life lost
- Potential years of life lost, males, females and persons, 2013 to 2017
Hospital admissions, and same-day admissions for dialysis for kidney disease - amendment
WA Health have advised that same-day dialysis activity in WA which was contracted to private facilities, but funded by public hospitals, has been double-counted in data published for recent years. The data items affected are:
- Male total admissions (excluding same-day admissions for renal dialysis) - Public and All hospitals
- Female total admissions (excluding same-day admissions for renal dialysis) - Public and All hospitals
- Total admissions (excluding same-day admissions for renal dialysis) - Public and All hospitals
- Same-day admissions for dialysis for kidney disease - Public and All hospitals
Cervical screening - amendment
Incorrect data for Victoria were identified in the previous release.
- Cervical screening participation, females aged 20 to 69 years, 2015 and 2016
- Cervical screening outcomes - Low grade abnormality, females aged 20 to 69 years, 2015 and 2016
- Cervical screening outcomes - High grade abnormality, females aged 20 to 69 years, 2015 and 2016
Data release: By quintile of socioeconomic disadvantage of area time series and Remoteness Area time series; and amendment
Social Health Atlases of Australia
The topics and indicators in this latest release are listed below. Click the matrix table below to view the data and the format by which they are published.
Child and youth health
- Infant mortality, 2013 to 2017
- Youth mortality, 2013 to 2017
Self-assessed health
- Estimated population, aged 15 years and over, with fair or poor self-assessed health (estimates), 2017-18
Prevalence of selected chronic diseases and conditions
- Estimated male population with mental and behavioural problems (estimates), 2017-18
- Estimated male population with mood (affective) problems (estimates), 2017-18
- Estimated female population with mental and behavioural problems (estimates), 2017-18
- Estimated female population with mood (affective) problems (estimates), 2017-18
- Estimated population with mental and behavioural problems (estimates), 2017-18
- Estimated population with mood (affective) problems (estimates), 2017-18
- Estimated population with respiratory system diseases (estimates), 2017-18
- Estimated population with asthma (estimates), 2017-18
- Estimated population with chronic obstructive pulmonary disease (estimates), 2017-18
- Estimated population with musculoskeletal system diseases (estimates), 2017-18
- Estimated population with arthritis (estimates), 2017-18
- Estimated population with rheumatoid arthritis (estimates), 2017-18
- Estimated population with osteoarthritis (estimates), 2017-18
Prevalence of selected health risk factors
- Estimated population, aged 18 years and over, with high or very high psychological distress based on the Kessler 10 Scale (K10) (estimates), 2017-18
- Estimated population, aged 18 years and over with high blood pressure (estimates), 2017-18
- Estimated male population, aged 18 years and over, who were overweight (but not obese) (estimates), 2017-18
- Estimated male population, aged 18 years and over, who were obese (estimates), 2017-18
- Estimated female population, aged 18 years and over, who were overweight (but not obese) (estimates), 2017-18
- Estimated female population, aged 18 years and over, who were obese (estimates), 2017-18
- Estimated population, aged 18 years and over, who were overweight (but not obese) (estimates), 2017-18
- Estimated population, aged 18 years and over, who were obese (estimates), 2017-18
- Estimated male population, aged 18 years and over, with a waist measurement indicating an increase/substantially increased risk of developing chronic diseases (estimates), 2017-18
- Estimated female population, aged 18 years and over, with a waist measurement indicating an increase/substantially increased risk of developing chronic diseases, (estimates), 2017-18
- Estimated population, aged 18 years and over, with a waist measurement indicating an increase/substantially increased risk of developing chronic diseases (estimates), 2017-18
- Estimated male population, aged 18 years and over, who were current smokers (estimates), 2017-18
- Estimated female population, aged 18 years and over, who were current smokers (estimates), 2017-18
- Estimated population, aged 18 years and over, who were current smokers (estimates), 2017-18
- Estimated population, aged 18 years and over, with adequate fruit intake (estimates), 2017-18
- Estimated population, aged 18 years and over, who undertook low, very low or no exercise in the previous week (estimates), 2017-18
Median age at death by sex (Quintiles of Socioeconomic Disadvantage of Area Time Series only)
- Median age at death of males, 2013 to 2017
- Median age at death of females, 2013 to 2017
- Median age at death of persons, 2013 to 2017
Premature mortality by sex
- Deaths of males aged 0 to 74 years, 2013 to 2017
- Deaths of females aged 0 to 74 years, 2013 to 2017
- Total deaths, persons aged 0 to 74 years, 2013 to 2017
Premature mortality by selected cause
- Deaths from cancer, persons aged 0 to 74 years, 2013 to 2017
- Deaths from colorectal cancer, persons aged 0 to 74 years, 2013 to 2017
- Deaths from lung cancer, persons aged 0 to 74 years, 2013 to 2017
- Deaths from breast cancer, females aged 0 to 74 years, 2013 to 2017
- Deaths from diabetes, persons aged 0 to 74 years, 2013 to 2017
- Deaths from circulatory system diseases, persons aged 0 to 74 years, 2013 to 2017
- Deaths from ischaemic heart disease, persons aged 0 to 74 years, 2013 to 2017
- Deaths from cerebrovascular disease, persons aged 0 to 74 years, 2013 to 2017
- Deaths from respiratory system diseases, persons aged 0 to 74 years, 2013 to 2017
- Deaths from chronic obstructive pulmonary disease, persons aged 0 to 74 years, 2013 to 2017
- Deaths from external causes, persons aged 0 to 74 years, 2013 to 2017
- Deaths from road traffic injuries, persons aged 0 to 74 years, 2013 to 2017
- Deaths from suicide and self-inflicted injuries, persons aged 0 to 74 years, 2013 to 2017
Avoidable mortality by sex
- Deaths from all avoidable causes, males aged 0 to 74 years, 2013 to 2017
- Deaths from all avoidable causes, females aged 0 to 74 years, 2013 to 2017
- Deaths from all avoidable causes, persons aged 0 to 74 years, 2013 to 2017
Avoidable mortality by selected cause
- Avoidable deaths from cancer, persons aged 0 to 74 years, 2013 to 2017
- Avoidable deaths from colorectal cancer, persons aged 0 to 74 years, 2013 to 2017
- Avoidable deaths from breast cancer, females aged 0 to 74 years, 2013 to 2017
- Avoidable deaths from diabetes, persons aged 0 to 74 years, 2013 to 2017
- Avoidable deaths from circulatory system diseases, persons aged 0 to 74 years, 2013 to 2017
- Avoidable deaths from ischaemic heart disease, persons aged 0 to 74 years, 2013 to 2017
- Avoidable deaths from cerebrovascular diseases, persons aged 0 to 74 years, 2013 to 2017
- Avoidable deaths from respiratory system diseases, persons aged 0 to 74 years, 2013 to 2017
- Avoidable deaths from chronic obstructive pulmonary disease, persons aged 0 to 74 years, 2013 to 2017
- Avoidable deaths from selected external causes of mortality (Falls; Fires, burns; Suicide and self-inflicted injuries; etc.), persons aged 0 to 74 years, 2013 to 2017
- Avoidable deaths from suicide and self-inflicted injuries, persons aged 0 to 74 years, 2013 to 2017
- Avoidable deaths from other external causes of mortality (Transport accidents; Accidental drowning and submersion; etc.), persons aged 0 to 74 years, 2013 to 2017
- Avoidable deaths from transport accidents, persons aged 0 to 74 years, 2013 to 2017
Hospital admissions, and same-day admissions for dialysis for kidney disease - amendment
WA Health have advised that same-day dialysis activity in WA which was contracted to private facilities, but funded by public hospitals, has been double-counted in data published for recent years. The data items affected are:
- Male total admissions (excluding same-day admissions for renal dialysis) - Public and All hospitals
- Female total admissions (excluding same-day admissions for renal dialysis) - Public and All hospitals
- Total admissions (excluding same-day admissions for renal dialysis) - Public and All hospitals
- Same-day admissions for dialysis for kidney disease - Public and All hospitals
Data release: By Indigenous Area, quintile of Indigenous Relative Socioeconomic Outcomes and Remoteness Areas; and amendment
Aboriginal & Torres Strait Islander Social Health Atlases of Australia
The topics and indicators in this latest release are listed below. Click the matrix table below to view the data and the format by which they are published.
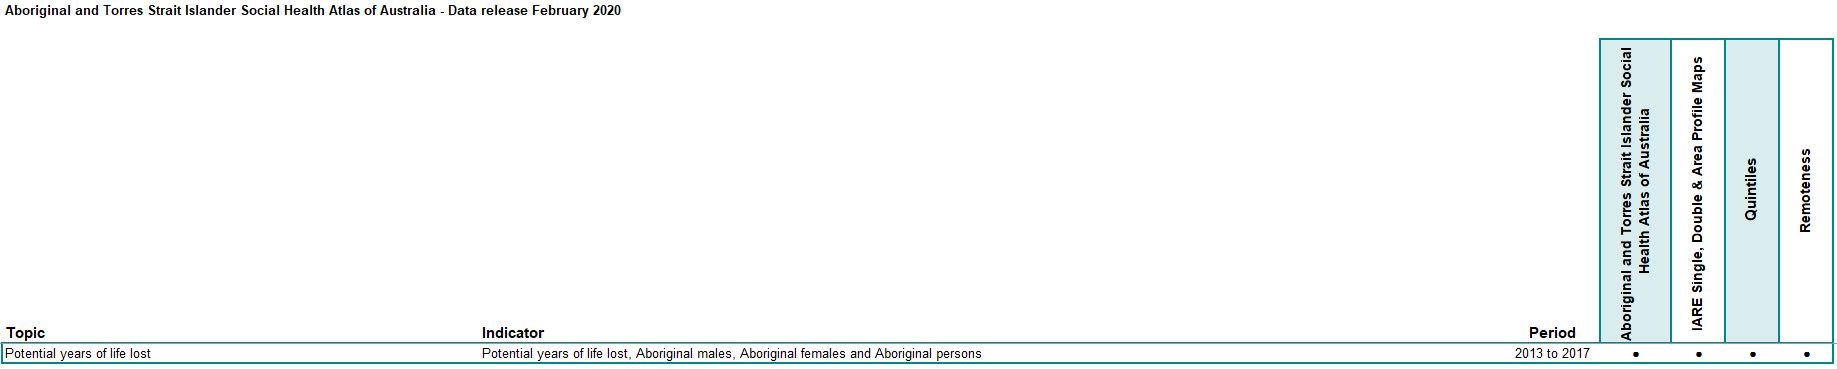
Potential years of life lost
- Potential years of life lost, Aboriginal males, Aboriginal females and Aboriginal persons, 2013 to 2017
Aboriginal Hospital admissions, and same-day admissions for dialysis for kidney disease - amendment
WA Health have advised that same-day dialysis activity in WA which was contracted to private facilities, but funded by public hospitals, has been double-counted in data published for recent years. The data items affected are:
- Male total admissions (excluding same-day admissions for renal dialysis)
- Female total admissions (excluding same-day admissions for renal dialysis)
- Total admissions (excluding same-day admissions for renal dialysis)
- Total admissions by age (excluding same-day admissions for renal dialysis)
- Same-day admissions for dialysis for kidney disease
Data release: 21 January 2020
Data release: By Population Health Area, Local Government Area, Primary Health Network
Social Health Atlases of Australia
The topics and indicators in this latest release are listed below. Click the matrix table below to view the data and the format by which they are published.
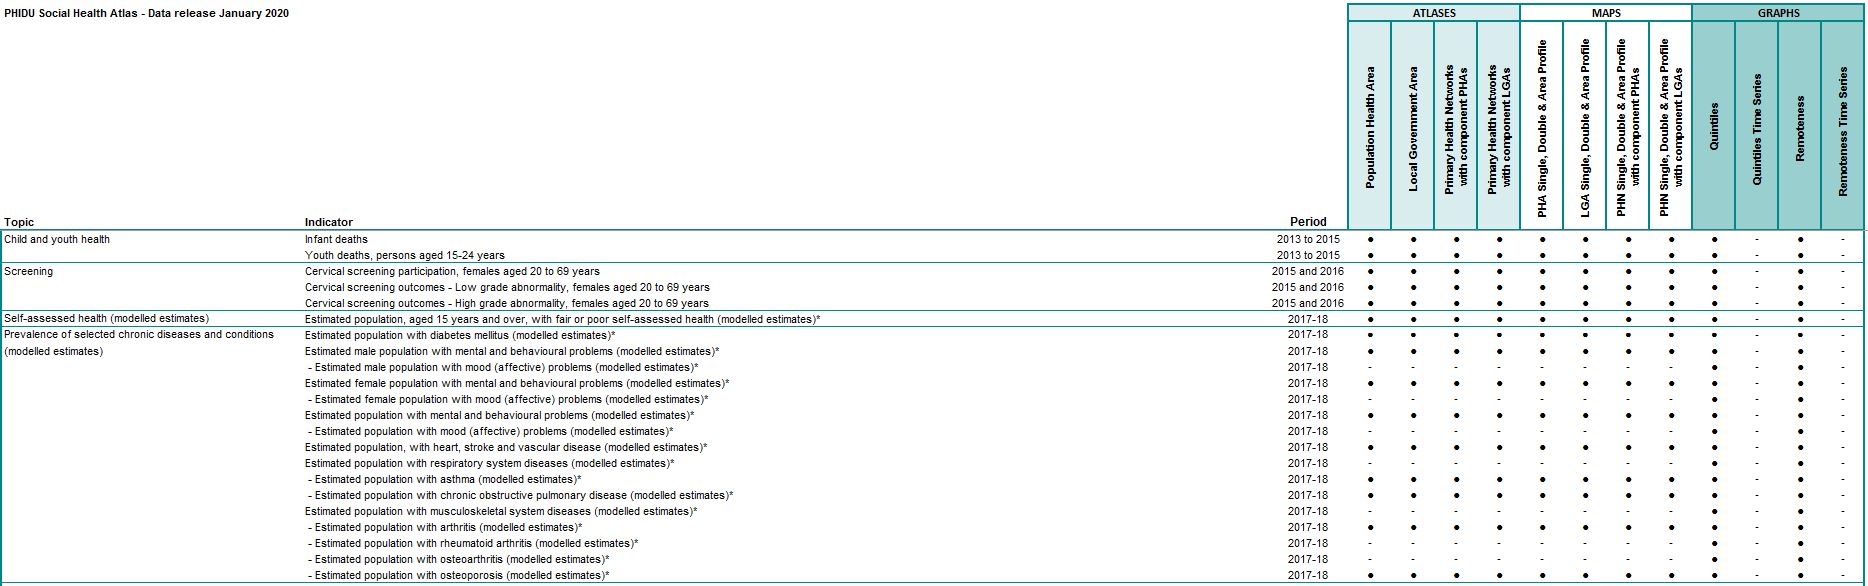
Child and youth health
- Infant mortality, 2013 to 2017
- Youth mortality, persons aged 15-24 years, 2013 to 2017
Screening
- Cervical screening participation, females aged 20 to 69 years, 2015 and 2016
- Cervical screening outcomes - Low grade abnormality, females aged 20 to 69 years, 2015 and 2016
- Cervical screening outcomes - High grade abnormality, females aged 20 to 69 years, 2015 and 2016
Self-assessed health (modelled estimates)
- Estimated population, aged 15 years and over, with fair or poor self-assessed health (modelled estimates), 2017-18
Prevalence of selected chronic diseases and conditions (modelled estimates)
- Estimated population with diabetes mellitus (modelled estimates), 2017-18
- Estimated male population with mental and behavioural problems (modelled estimates), 2017-18
- Estimated female population with mental and behavioural problems (modelled estimates), 2017-18
- Estimated population with mental and behavioural problems (modelled estimates), 2017-18
- Estimated population, with heart, stroke and vascular disease (modelled estimates), 2017-18
- Estimated population with asthma (modelled estimates), 2017-18
- Estimated population with chronic obstructive pulmonary disease (modelled estimates), 2017-18
- Estimated population with arthritis (modelled estimates), 2017-18
- Estimated population with osteoporosis (modelled estimates), 2017-18
Prevalence of selected health risk factors (modelled estimates)
Adults
- Estimated male population, aged 18 years and over, with high or very high psychological distress based on the Kessler 10 Scale (K10) (modelled estimates), 2017-18
- Estimated female population, aged 18 years and over, with high or very high psychological distress based on the Kessler 10 Scale (K10) (modelled estimates), 2017-18
- Estimated population , aged 18 years and over, with high or very high psychological distress based on the Kessler 10 Scale (K10) (modelled estimates), 2017-18
- Estimated population, aged 18 years and over with high blood pressure (modelled estimates), 2017-18
- Estimated male population, aged 18 years and over, who were overweight (but not obese) (modelled estimates), 2017-18
- Estimated male population, aged 18 years and over, who were obese (modelled estimates), 2017-18
- Estimated female population, aged 18 years and over, who were overweight (but not obese) (modelled estimates), 2017-18
- Estimated female population, aged 18 years and over, who were obese (modelled estimates), 2017-18
- Estimated population, aged 18 years and over, who were overweight (but not obese) (modelled estimates), 2017-18
- Estimated population, aged 18 years and over, who were obese (modelled estimates), 2017-18
- Estimated male population, aged 18 years and over, who were current smokers (modelled estimates), 2017-18
- Estimated female population, aged 18 years and over, who were current smokers (modelled estimates), 2017-18
- Estimated population, aged 18 years and over, who were current smokers (modelled estimates), 2017-18
- Estimated male population, aged 18 years and over, consuming alcohol at levels considered to be a high risk to health over their lifetime (modelled estimates), 2017-18
- Estimated female population, aged 18 years and over, consuming alcohol at levels considered to be a high risk to health over their lifetime (modelled estimates), 2017-18
- Estimated population, aged 18 years and over, consuming alcohol at levels considered to be a high risk to health over their lifetime (modelled estimates), 2017-18
- Estimated population, aged 18 years and over, with adequate fruit intake (modelled estimates), 2017-18
- Estimated population, aged 18 years and over, who undertook no or low exercise in the previous week (modelled estimates), 2017-18
Children and young people
- Estimated male population, aged 2 to 17 years, who were overweight (but not obese) (modelled estimates), 2017-18
- Estimated male population, aged 2 to 17 years, who were obese (modelled estimates), 2017-18
- Estimated female population, aged 2 to 17 years, who were overweight (but not obese) (modelled estimates), 2017-18
- Estimated female population, aged 2 to 17 years, who were obese (modelled estimates), 2017-18
- Estimated population, aged 2 to 17 years, who were overweight (but not obese) (modelled estimates), 2017-18
- Estimated population, aged 2 to 17 years, who were obese (modelled estimates), 2017-18
Median age at death by sex
- Median age at death of males, 2013 to 2017
- Median age at death of females, 2013 to 2017
- Median age at death of persons, 2013 to 2017
Premature mortality by sex
- Deaths of males aged 0 to 74 years, 2013 to 2017
- Deaths of females aged 0 to 74 years, 2013 to 2017
- Total deaths, persons aged 0 to 74 years, 2013 to 2017
Premature mortality by selected cause
- Deaths from cancer, persons aged 0 to 74 years, 2013 to 2017
- Deaths from colorectal cancer, persons aged 0 to 74 years, 2013 to 2017
- Deaths from lung cancer, persons aged 0 to 74 years, 2013 to 2017
- Deaths from breast cancer, females aged 0 to 74 years, 2013 to 2017
- Deaths from diabetes, persons aged 0 to 74 years, 2013 to 2017
- Deaths from circulatory system diseases, persons aged 0 to 74 years, 2013 to 2017
- Deaths from ischaemic heart disease, persons aged 0 to 74 years, 2013 to 2017
- Deaths from cerebrovascular disease, persons aged 0 to 74 years, 2013 to 2017
- Deaths from respiratory system diseases, persons aged 0 to 74 years, 2013 to 2017
- Deaths from chronic obstructive pulmonary disease, persons aged 0 to 74 years, 2013 to 2017
- Deaths from external causes, persons aged 0 to 74 years, 2013 to 2017
- Deaths from road traffic injuries, persons aged 0 to 74 years, 2013 to 2017
- Deaths from suicide and self-inflicted injuries, persons aged 0 to 74 years, 2013 to 2017
Avoidable mortality by sex
- Deaths from all avoidable causes, males aged 0 to 74 years, 2013 to 2017
- Deaths from all avoidable causes, females aged 0 to 74 years, 2013 to 2017
- Deaths from all avoidable causes, persons aged 0 to 74 years, 2013 to 2017
Avoidable mortality by selected cause
- Avoidable deaths from cancer, persons aged 0 to 74 years, 2013 to 2017
- Avoidable deaths from colorectal cancer, persons aged 0 to 74 years, 2013 to 2017
- Avoidable deaths from breast cancer, females aged 0 to 74 years, 2013 to 2017
- Avoidable deaths from diabetes, persons aged 0 to 74 years, 2013 to 2017
- Avoidable deaths from circulatory system diseases, persons aged 0 to 74 years, 2013 to 2017
- Avoidable deaths from ischaemic heart disease, persons aged 0 to 74 years, 2013 to 2017
- Avoidable deaths from cerebrovascular diseases, persons aged 0 to 74 years, 2013 to 2017
- Avoidable deaths from respiratory system diseases, persons aged 0 to 74 years, 2013 to 2017
- Avoidable deaths from chronic obstructive pulmonary disease, persons aged 0 to 74 years, 2013 to 2017
- Avoidable deaths from selected external causes of mortality (Falls; Fires, burns; Suicide and self-inflicted injuries; etc.), persons aged 0 to 74 years, 2013 to 2017
- Avoidable deaths from suicide and self-inflicted injuries, persons aged 0 to 74 years, 2013 to 2017
- Avoidable deaths from other external causes of mortality (Transport accidents; Accidental drowning and submersion; etc.), persons aged 0 to 74 years, 2013 to 2017
- Avoidable deaths from transport accidents, persons aged 0 to 74 years, 2013 to 2017
Data release: By quintile of socioeconomic disadvantage of area and Remoteness Area
Social Health Atlases of Australia
The topics and indicators in this latest release are listed below. Click the matrix table below to view the data and the format by which they are published.
Child and youth health
- Infant mortality, 2013 to 2017
- Youth mortality, persons aged 15-24 years, 2013 to 2017
Screening
- Cervical screening participation, females aged 20 to 69 years, 2015 and 2016
- Cervical screening outcomes - Low grade abnormality, females aged 20 to 69 years, 2015 and 2016
- Cervical screening outcomes - High grade abnormality, females aged 20 to 69 years, 2015 and 2016
Self-assessed health (estimates)
- Estimated population, aged 15 years and over, with fair or poor self-assessed health, 2017-18
Prevalence of selected chronic diseases and conditions (estimates)
- Estimated population with diabetes mellitus, 2017-18
- Estimated male population with mental and behavioural problems, 2017-18
- Estimated male population with mood (affective) problems, 2017-18
- Estimated female population with mental and behavioural problems, 2017-18
- Estimated female population with mood (affective) problems, 2017-18
- Estimated population with mental and behavioural problems, 2017-18
- Estimated population with mood (affective) problems, 2017-18
- Estimated population, with heart, stroke and vascular disease, 2017-18
- Estimated population with respiratory system diseases, 2017-18
- Estimated population with asthma, 2017-18
- Estimated population with chronic obstructive pulmonary disease, 2017-18
- Estimated population with musculoskeletal system diseases, 2017-18
- Estimated population with arthritis, 2017-18
- Estimated population with rheumatoid arthritis, 2017-18
- Estimated population with osteoarthritis, 2017-18
- Estimated population with osteoporosis, 2017-18
Prevalence of selected health risk factors (estimates)
Adults
- Estimated male population, aged 18 years and over, with high or very high psychological distress based on the Kessler 10 Scale (K10), 2017-18
- Estimated female population, aged 18 years and over, with high or very high psychological distress based on the Kessler 10 Scale (K10), 2017-18
- Estimated population, aged 18 years and over, with high or very high psychological distress based on the Kessler 10 Scale (K10), 2017-18
- Estimated population, aged 18 years and over with high blood pressure, 2017-18
- Estimated male population, aged 18 years and over, who were overweight (but not obese), 2017-18
- Estimated male population, aged 18 years and over, who were obese, 2017-18
- Estimated female population, aged 18 years and over, who were overweight (but not obese), 2017-18
- Estimated female population, aged 18 years and over, who were obese, 2017-18
- Estimated population, aged 18 years and over, who were overweight (but not obese), 2017-18
- Estimated population, aged 18 years and over, who were obese, 2017-18
- Estimated male population, aged 18 years and over, with a waist measurement indicating an increase/substantially increased risk of developing chronic diseases, 2017-18
- Estimated female population, aged 18 years and over, with a waist measurement indicating an increase/substantially increased risk of developing chronic diseases, 2017-18
- Estimated population, aged 18 years and over, with a waist measurement indicating an increase/substantially increased risk of developing chronic diseases, 2017-18
- Estimated male population, aged 18 years and over, who were current smokers, 2017-18
- Estimated female population, aged 18 years and over, who were current smokers, 2017-18
- Estimated population, aged 18 years and over, who were current smokers, 2017-18
- Estimated male population, aged 18 years and over, consuming alcohol at levels considered to be a high risk to health over their lifetime, 2017-18
- Estimated female population, aged 18 years and over, consuming alcohol at levels considered to be a high risk to health over their lifetime, 2017-18
- Estimated population, aged 18 years and over, consuming alcohol at levels considered to be a high risk to health over their lifetime, 2017-18
- Estimated population, aged 18 years and over, with adequate fruit intake, 2017-18
- Estimated population, aged 18 years and over, who undertook low, very low or no exercise in the previous week, 2017-18
Children and young people
- Estimated male population, aged 2 to 17 years, who were overweight (but not obese), 2017-18
- Estimated male population, aged 2 to 17 years, who were obese, 2017-18
- Estimated female population, aged 2 to 17 years, who were overweight (but not obese), 2017-18
- Estimated female population, aged 2 to 17 years, who were obese, 2017-18
- Estimated population, aged 2 to 17 years, who were overweight (but not obese), 2017-18
- Estimated population, aged 2 to 17 years, who were obese, 2017-18
- Estimated population, aged 4 to 17 years, with adequate fruit intake, 2017-18
Median age at death by sex
- Median age at death of males, 2013 to 2017
- Median age at death of females, 2013 to 2017
- Median age at death of persons, 2013 to 2017
Premature mortality by sex
- Deaths of males aged 0 to 74 years, 2013 to 2017
- Deaths of females aged 0 to 74 years, 2013 to 2017
- Total deaths, persons aged 0 to 74 years, 2013 to 2017
Premature mortality by selected cause
- Deaths from cancer, persons aged 0 to 74 years, 2013 to 2017
- Deaths from colorectal cancer, persons aged 0 to 74 years, 2013 to 2017
- Deaths from lung cancer, persons aged 0 to 74 years, 2013 to 2017
- Deaths from breast cancer, females aged 0 to 74 years, 2013 to 2017
- Deaths from diabetes, persons aged 0 to 74 years, 2013 to 2017
- Deaths from circulatory system diseases, persons aged 0 to 74 years, 2013 to 2017
- Deaths from ischaemic heart disease, persons aged 0 to 74 years, 2013 to 2017
- Deaths from cerebrovascular disease, persons aged 0 to 74 years, 2013 to 2017
- Deaths from respiratory system diseases, persons aged 0 to 74 years, 2013 to 2017
- Deaths from chronic obstructive pulmonary disease, persons aged 0 to 74 years, 2013 to 2017
- Deaths from external causes, persons aged 0 to 74 years, 2013 to 2017
- Deaths from road traffic injuries, persons aged 0 to 74 years, 2013 to 2017
- Deaths from suicide and self-inflicted injuries, persons aged 0 to 74 years, 2013 to 2017
Avoidable mortality by sex
- Deaths from all avoidable causes, males aged 0 to 74 years, 2013 to 2017
- Deaths from all avoidable causes, females aged 0 to 74 years, 2013 to 2017
- Deaths from all avoidable causes, persons aged 0 to 74 years, 2013 to 2017
Avoidable mortality by selected cause
- Avoidable deaths from cancer, persons aged 0 to 74 years, 2013 to 2017
- Avoidable deaths from colorectal cancer, persons aged 0 to 74 years, 2013 to 2017
- Avoidable deaths from breast cancer, females aged 0 to 74 years, 2013 to 2017
- Avoidable deaths from diabetes, persons aged 0 to 74 years, 2013 to 2017
- Avoidable deaths from circulatory system diseases, persons aged 0 to 74 years, 2013 to 2017
- Avoidable deaths from ischaemic heart disease, persons aged 0 to 74 years, 2013 to 2017
- Avoidable deaths from cerebrovascular diseases, persons aged 0 to 74 years, 2013 to 2017
- Avoidable deaths from respiratory system diseases, persons aged 0 to 74 years, 2013 to 2017
- Avoidable deaths from chronic obstructive pulmonary disease, persons aged 0 to 74 years, 2013 to 2017
- Avoidable deaths from selected external causes of mortality (Falls; Fires, burns; Suicide and self-inflicted injuries; etc.), persons aged 0 to 74 years, 2013 to 2017
- Avoidable deaths from suicide and self-inflicted injuries, persons aged 0 to 74 years, 2013 to 2017
- Avoidable deaths from other external causes of mortality (Transport accidents; Accidental drowning and submersion; etc.), persons aged 0 to 74 years, 2013 to 2017
- Avoidable deaths from transport accidents, persons aged 0 to 74 years, 2013 to 2017
Data release: By Indigenous Area, quintile of Indigenous Relative Socioeconomic Outcomes and Remoteness Areas
Aboriginal & Torres Strait Islander Social Health Atlases of Australia
The topics and indicators in this latest release are listed below. Click the matrix table below to view the data and the format by which they are published.
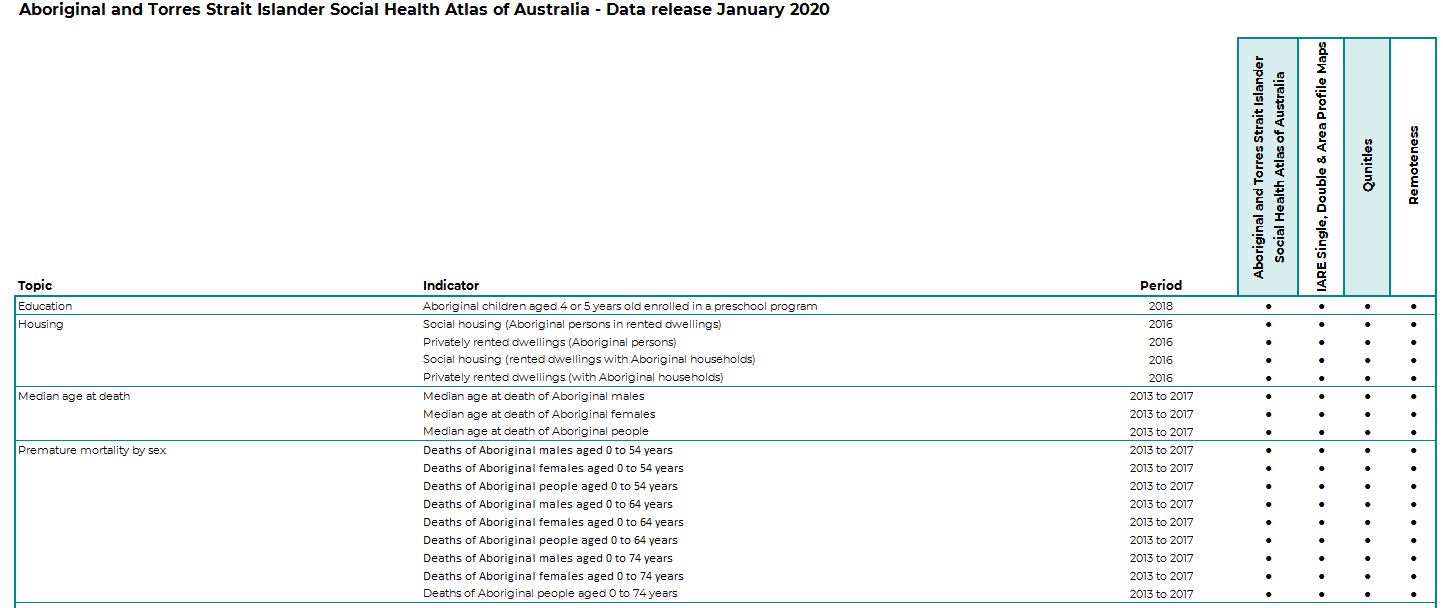
Education
- Aboriginal children aged 4 or 5 years old enrolled in a preschool program, 2018
Housing
- Social housing (Aboriginal persons in rented dwellings), 2016
- Privately rented dwellings (Aboriginal persons), 2016
- Social housing (rented dwellings with Aboriginal households), 2016
- Privately rented dwellings (with Aboriginal households), 2016
Median age at death
- Median age at death of Aboriginal males, 2013 to 2017
- Median age at death of Aboriginal females, 2013 to 2017
- Median age at death of Aboriginal people, 2013 to 2017
Premature mortality by sex
- Deaths of Aboriginal males aged 0 to 54 years, 2013 to 2017
- Deaths of Aboriginal females aged 0 to 54 years, 2013 to 2017
- Deaths of Aboriginal people aged 0 to 54 years, 2013 to 2017
- Deaths of Aboriginal males aged 0 to 64 years, 2013 to 2017
- Deaths of Aboriginal females aged 0 to 64 years, 2013 to 2017
- Deaths of Aboriginal people aged 0 to 64 years, 2013 to 2017
- Deaths of Aboriginal males aged 0 to 74 years, 2013 to 2017
- Deaths of Aboriginal females aged 0 to 74 years, 2013 to 2017
- Deaths of Aboriginal people aged 0 to 74 years, 2013 to 2017
Premature mortality by selected cause
- Deaths from cancer, Aboriginal people aged 0 to 54 years, 2013 to 2017
- Deaths from circulatory system diseases, Aboriginal people aged 0 to 54 years, 2013 to 2017
- Deaths from respiratory system diseases, Aboriginal people aged 0 to 54 years, 2013 to 2017
- Deaths from external causes, Aboriginal people aged 0 to 54 years, 2013 to 2017
- Deaths from cancer, Aboriginal people aged 0 to 64 years, 2013 to 2017
- Deaths from circulatory system diseases, Aboriginal people aged 0 to 64 years, 2013 to 2017
- Deaths from respiratory system diseases, Aboriginal people aged 0 to 64 years, 2013 to 2017
- Deaths from external causes, Aboriginal people aged 0 to 64 years, 2013 to 2017
- Deaths from cancer, Aboriginal people aged 0 to 74 years, 2013 to 2017
- Deaths from circulatory system diseases, Aboriginal people aged 0 to 74 years, 2013 to 2017
- Deaths from respiratory system diseases, Aboriginal people aged 0 to 74 years, 2013 to 2017
- Deaths from external causes, Aboriginal people aged 0 to 74 years, 2013 to 2017
Avoidable mortality by sex
- Avoidable deaths of Aboriginal males aged 0 to 74 years, 2013 to 2017
- Avoidable deaths of Aboriginal females aged 0 to 74 years, 2013 to 2017
- Avoidable deaths of Aboriginal people aged 0 to 74 years, 2013 to 2017
Avoidable mortality by selected cause
- Avoidable deaths from cancer, Aboriginal people aged 0 to 74 years, 2013 to 2017
- Avoidable deaths from diabetes, Aboriginal people aged 0 to 74 years, 2013 to 2017
- Avoidable deaths from circulatory system diseases, Aboriginal people aged 0 to 74 years, 2013 to 2017
- Avoidable deaths from respiratory system diseases, Aboriginal people aged 0 to 74 years, 2013 to 2017
- Avoidable deaths from selected external causes, Aboriginal people aged 0 to 74 years, 2013 to 2017
- Avoidable deaths from other external causes, Aboriginal people aged 0 to 74 years, 2013 to 2017