 Back to Torrens
Information on deaths from heart disease: background to data and references in the article in The Conversation, July 2022
Definition:
Heart, stroke and vascular disease encompasses a range of circulatory conditions. Commonly, this group of conditions is referred to under the broader term of 'heart disease' (as used in this document) and includes
- ischaemic heart disease (also called coronary heart disease)
- atrial fibrillation
- heart failure and cardiomyopathy
- stroke
- peripheral arterial disease
- congenital heart disease
- rheumatic heart disease [1].
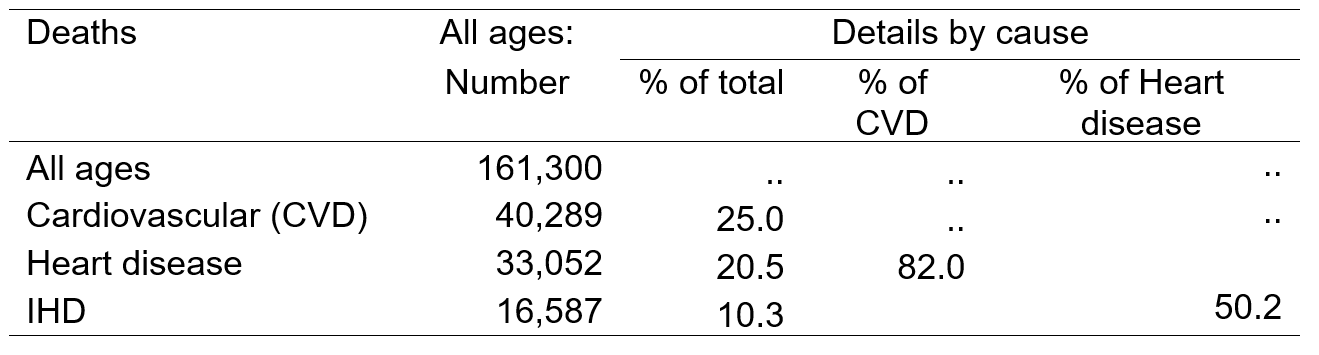
The 40,289 deaths from cardiovascular disease in 2020 accounted for 25% of all deaths, of which deaths from ischaemic heart disease accounted for the largest proportion (82% of deaths from cardiovascular disease).
Risk factors and disease burden:
The disease burden for heart disease can be attributed to several risk factors. In 2015, dietary risk factors were responsible for the most burden (62%), followed by high blood pressure (43%), high cholesterol (37%), overweight and obesity (25%), tobacco use (14%) and physical inactivity (12%). It is important to note that these risk factors overlap and, as a result, the associated risk does not sum to 100% [2].
Selected risk factors and socioeconomic status
For some risk factors, data are available by socioeconomic status. These are presented below in two charts, to enable comparisons across the socioeconomic gradient to be made more easily.
The first chart shows that the widest equity gap is for smoking, with the rate in the most disadvantaged areas (Quintile 5) almost three (2.87) times that in the least disadvantaged areas (Quintile 1). The difference in rates between the most disadvantaged and least disadvantaged areas for those reporting they engaged in insufficient physical activity, or had high blood pressure, were lower, but still marked, at 35% and 56% higher, respectively.
In each case, those in the intervening quintiles had higher rates than those in the most advantaged areas (Quintile 1).
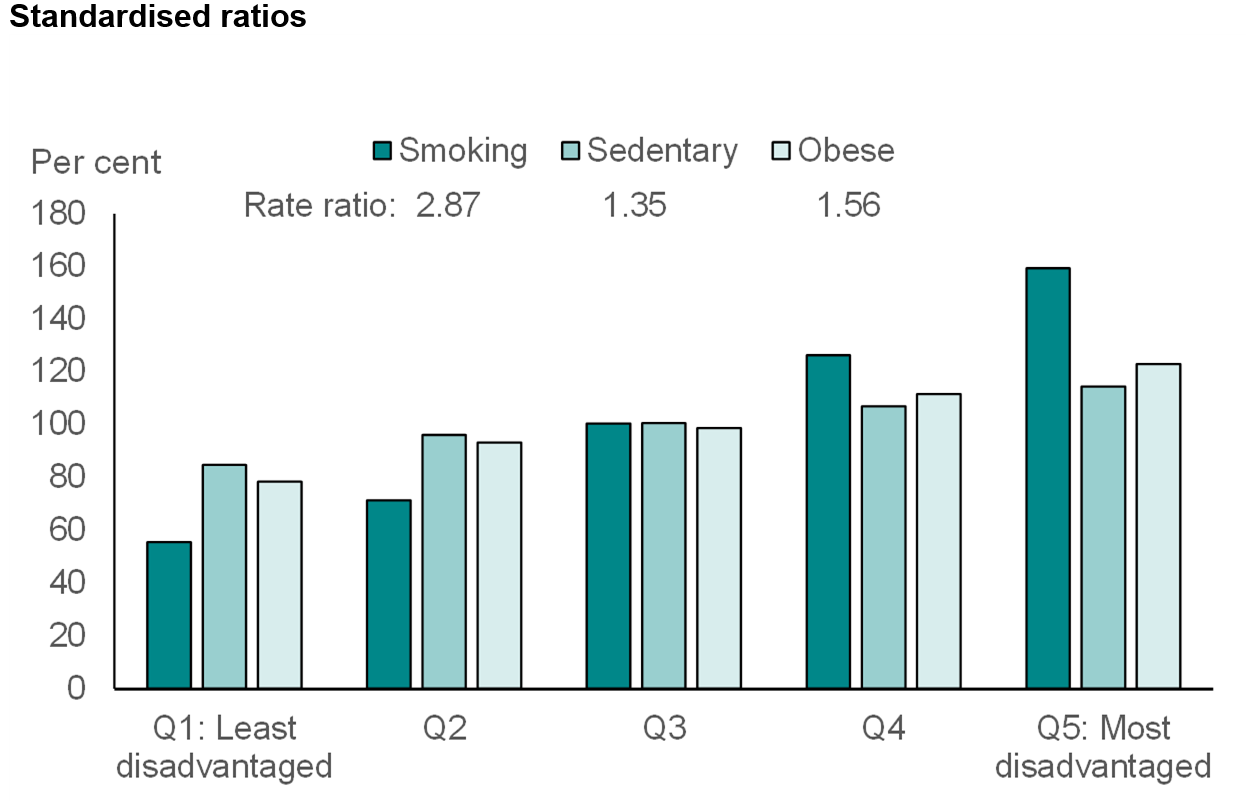
Notes: ‘Sedentary’ comprises people reporting that they had low, very low or no physical activity in the two-week reference period of the survey
The rate ratio is the ratio between the age-standardised rate in Q5 (Quintile 5) to the rate in Q1 (Quintile 1)
Source: PHIDU, available at https://phidu.torrens.edu.au/current/graphs/sha-aust/quintiles/aust/risk-factors.html; last accessed 20 June 2022
Again, there is a steady increase in rates with increasing disadvantage, with overall differences between the between the most disadvantaged and least disadvantaged areas of 21% for high blood pressure and 15% for inadequate fruit intake.
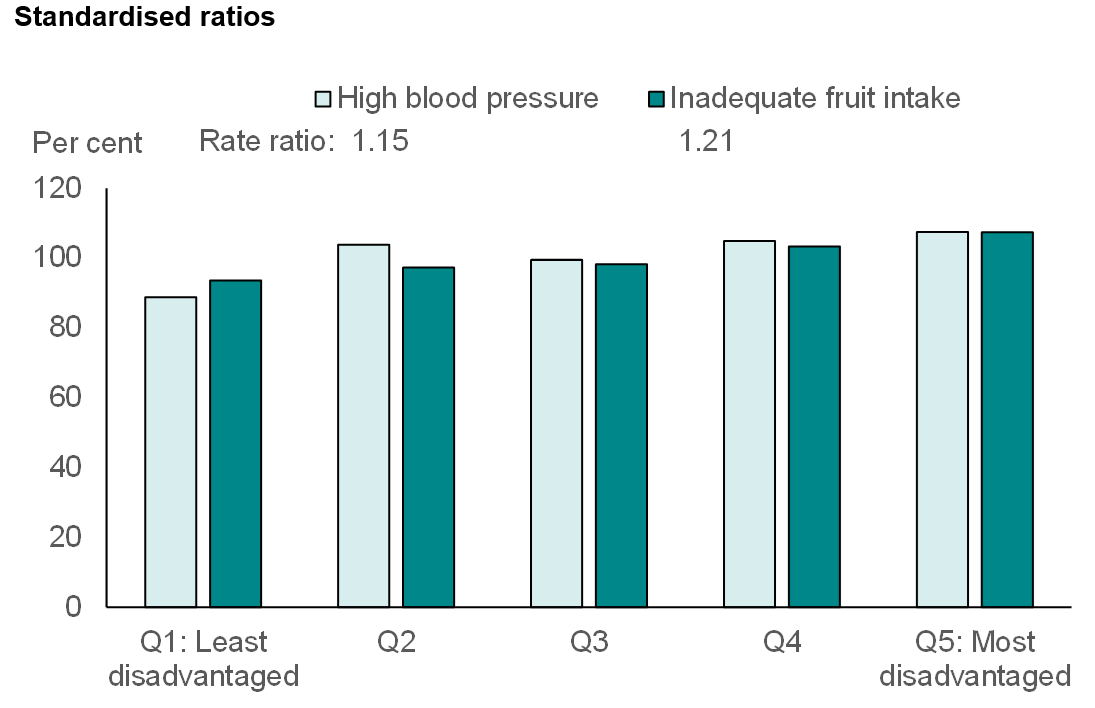
Notes: The rate ratio is the ratio between the age-standardised rate in Q5 (Quintile 5) to the rate in Q1 (Quintile 1)
Source: PHIDU, available at https://phidu.torrens.edu.au/current/graphs/sha-aust/quintiles/aust/risk-factors.html; last accessed 20 June 2022
Data:
The deaths data presented in the following analysis were compiled by PHIDU from data based on the 2020 Cause of Death Unit Record Files supplied by the Australian Coordinating Registry and the Victorian Department of Justice, on behalf of the Registries of Births, Deaths and Marriages and the National Coronial Information System. The population used in calculating rates is the ABS Estimated Resident Population (ERP) for Australia, 30 June 2020.
Whole population
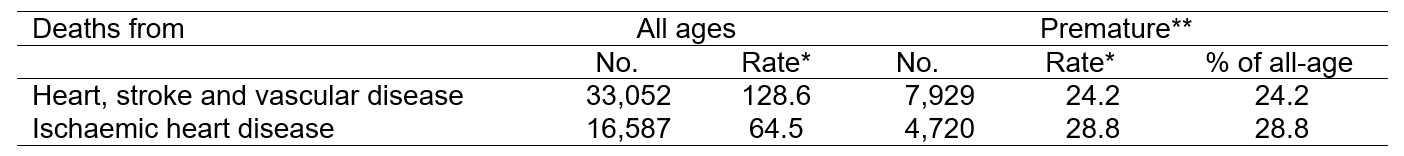
*Rate is the age-standardised rate per 100,000 population
**Premature deaths are those that occurred before 75 years of age
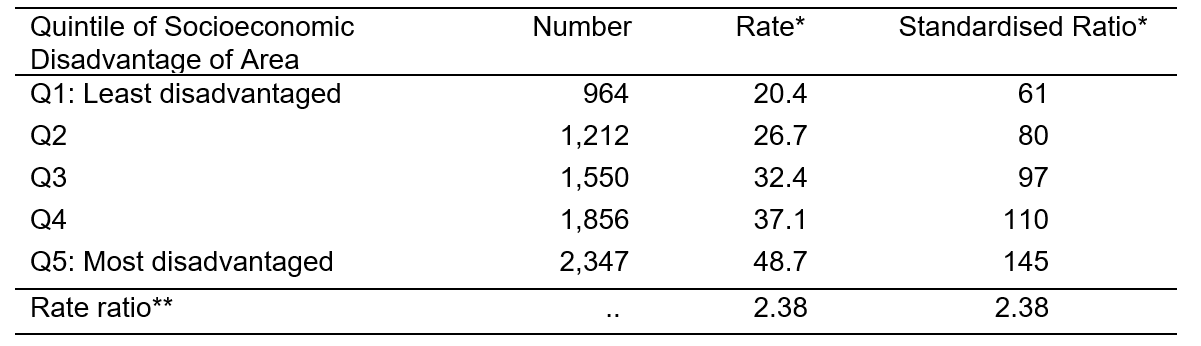
*Rate is the age-standardised rate per 100,000 population
**Rate ratio is the ratio of the rate in Q5 to that in Q1
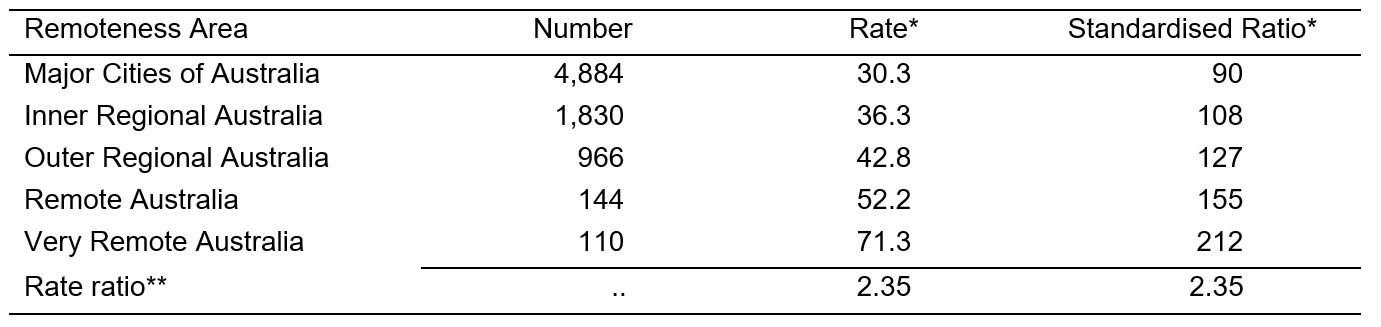
*Rate is the age-standardised rate per 100,000 population
**Rate ratio is the ratio of the rate in Very Remote Australia to that in Major Cities of Australia
Population by Indigenous status, 2020 – are rates here still per 100,000?
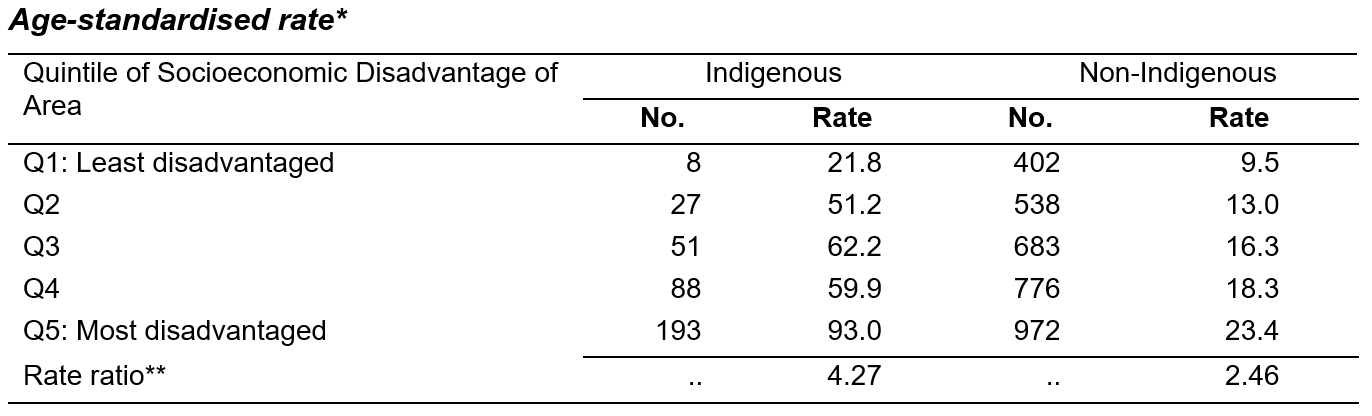
*Rate is the age-standardised rate per 100,000 population
**Rate ratio is the ratio of the rate in Q5 to that in Q1
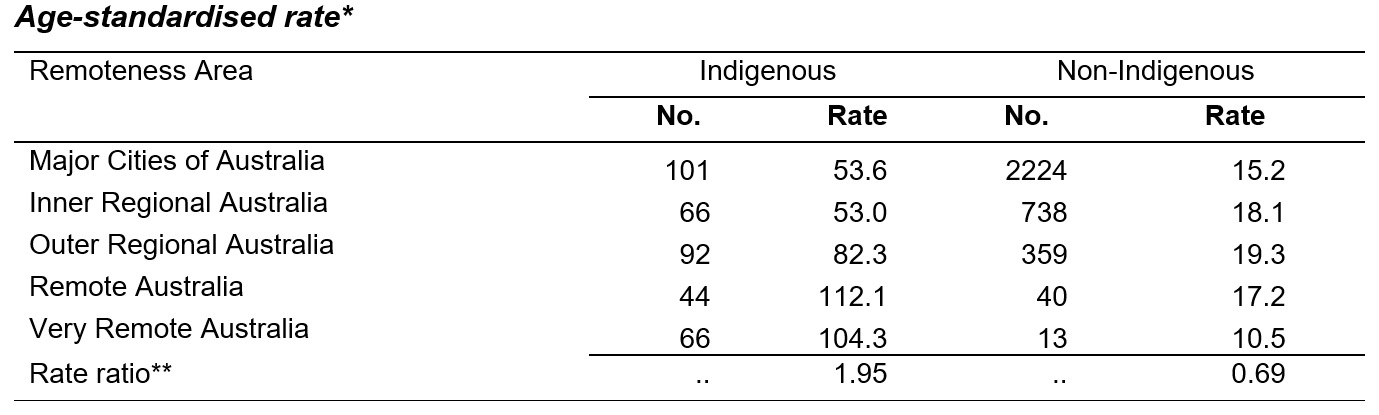
*Rate is the age-standardised rate per 100,000 population
**Rate ratio is the ratio of the rate in Very Remote Australia to that in Major Cities of Australia
References:
[1] Australian Bureau of Statistics (ABS). Heart, stroke and vascular disease. Canberra: ABS; 2018. Available from https://www.abs.gov.au/statistics/health/health-conditions-and-risks/heart-stroke-and-vascular-disease/latest-release; last accessed 17 June 2022
[2] Australian Institute of Health and Welfare (AIHW). Available from:https://www.aihw.gov.au/reports/australias-health/coronary-heart-disease; last accessed 21 March 2022