 Back to Torrens
Modelled estimates
The modelled estimates of the prevalence of chronic disease and associated risk factors have been produced at the Population Health Area (PHA) level from the 2011-12 Australian Health Survey (AHS) or the 2014-15 National Health Survey (NHS), conducted by the Australian Bureau of Statistics (ABS), and known characteristics of the area.
A modelled estimate can be interpreted as the likely value for a ‘typical' area with those characteristics: the PHA is the area level of interest for this project. This work was undertaken by the ABS, as they hold the AHS unit record files on which the model is based: the small area data were compiled by PHIDU.
The approach used is to undertake an analysis of the survey data for Australia to identify associations in the AHS data between the variables that we wish to predict at the area level (e.g., prevalence of chronic conditions and risk factors) and the data we have at the area level (e.g., socioeconomic status, use of health services). The relationship between these variables for which we have area level data (the predictors) and the reporting of chronic conditions in the AHS/ NHS is also a part of the model that is developed by the ABS. For example, such associations might be between the number of people reporting specified chronic conditions in the AHS and:
- the proportion of the population receiving a pension or benefit;
- the proportion of the population with a profound or severe disability and socioeconomic status (as indicated by Census data).
The results of the modelling exercise are then applied to the PHA counts of the predictors to produce an estimate of the number of people with the particular characteristic in each PHA. The ABS scaled the predictions at the PHA level to sum to State and Territory totals.
The numbers are estimates for an area, not measured events as are, for example, death statistics. As such, they should be viewed as a tool that, when used in conjunction with local area knowledge and taking into consideration the prediction reliability, can provide useful information that can assist with decision making for small geographic regions. Of particular note is that the true value of the published estimates is also likely to vary within a range of values as shown by the upper and lower limits published in the data (xls) and viewable in the bar chart in the single maps.
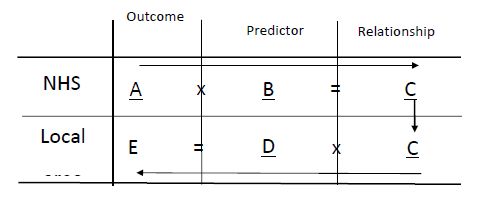
A = Variables in AHS to be predicted at small area level - outcome variables
B = Variables in AHS (and available at local area level (D)) - predictor variables
C = Relationships between A and B found in AHS data (from modelling AHS data) for predictor variables
D = Variables at local area level also in AHS - predictor variables
E = Modelled estimates Note: Underlining indicates known data (for C, is a known (calculated) relationship)
The information supplied to PHIDU by the ABS included the predicted number of people with each condition/ risk behaviour, the population at risk (e.g., the population aged two years and over, or 18 years and over, as appropriate to the variable) and the proportion of the population with each condition/ risk behaviour. As the predictions for overweight and obesity were based on data for the 84.3% of the population aged 18 years and over whose height and weight had been measured, and the population at risk was the total Australian population at these ages, PHIDU scaled this population to sum to the population measured at the State and Territory level. The predictions were then age standardised, to adjust for the effects of differences in the age profiles of areas.
The NHS and AHS' response rate of around 85% provides a high level of coverage across the population; however, the response rate among some groups, e.g., those living in the most disadvantaged areas, is lower than among those in less disadvantaged areas. Although the sample includes the majority of people living in households in private dwellings, it excludes those living in the most remote areas of Australia; whereas these areas comprise less than 3% of the total population, Aboriginal people comprise up to one third of the population in these areas. This and other limitations of the method mean that estimates have not been published for PHAs with populations under 1,000, or with a high proportion of their population in:
- non-private dwellings (hospitals, gaols, nursing homes - and also excludes members of the armed forces)
- in Very Remote areas;
- in discrete Aboriginal communities; or
- where the relative root mean square errors (RRMSEs) on the estimates was 1 or more (estimate replaced with ≠).
Note: Estimates with RRMSEs from 0.25 and to 0.50 have been marked (~) to indicate that they should be used with caution; and those greater than 0.50 but less than 1 are marked (~~) to indicate that the estimate is considered too unreliable for general use.