Notes on the data: Emergency department presentations
Indigenous emergency department presentations, 2020/21
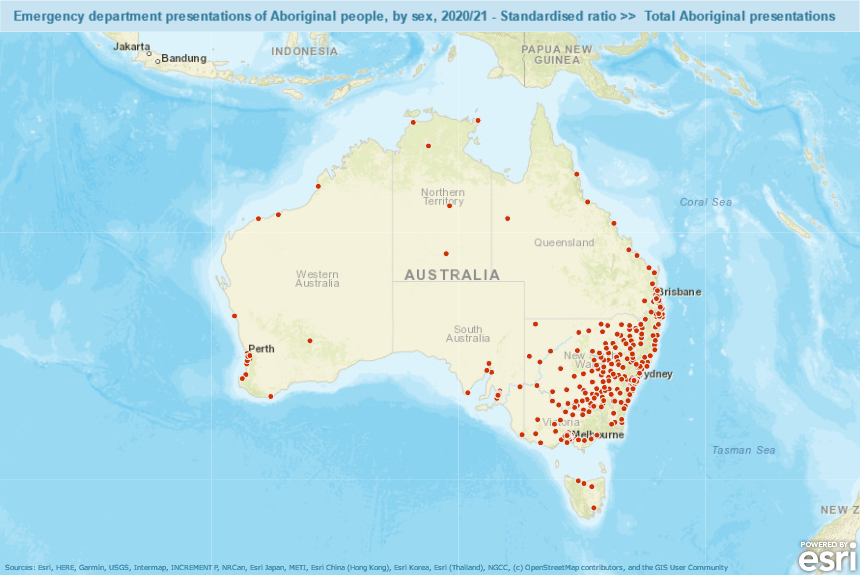
Policy context: In 2020-21 in Australia there were 291 public hospitals that have purpose-built emergency departments (ED) that are staffed 24 hours a day, seven days a week, to provide acute and emergency care to patients arriving either by ambulance or by other means. However, relatively few of these are available in regional (other than in New South Wales) or remote areas where many Aboriginal people live; see map, below.
Source: https://phidu.torrens.edu.au/current/maps/atsi-sha/iare-single-map/atlas.html (with ‘Public Hospital emergency departments’ selected, and ‘Indigenous Areas’ turned off, in ‘Legend’ box.)
Timely access to care is a high priority for patients, health care providers and the public at large. Although there needs to be an appropriate balance between primary and acute care, EDs play an important role as a safety net in the health system, providing care to people who are unable to access services elsewhere, such as care from general practitioners [2]. Examples include people who are homeless or transient, and Aboriginal and Torres Strait Islanders, or the need for care after hours.
An ED service event can be commenced by a doctor, nurse, mental health practitioner or other health professional, when investigation, care and/or treatment is provided in accordance with an established clinical pathway defined by the ED [3]. The data include both presentations at formal EDs and emergency occasions of service provided through other arrangements, particularly in smaller hospitals located in regional and remote areas.
The Australian Institute of Health and Welfare report [4] that the average access to General Practitioners relative to need decreases with remoteness for the Indigenous population. This is due to the worsening access to General Practitioners from metropolitan to remote areas and the increasing predicted need for primary health care based on the Indigenous population’s demographic structure which also varies across the remoteness gradient. This trend poses health care issues for the Indigenous population since a large proportion of the population live outside metropolitan areas. These factors lead to hospitals, particularly Emergency Departments, becoming the primary health service provider for many in the Indigenous population, although such services are not always available to Indigenous communities.
Of note, is that the quality of the data reported for Indigenous status in emergency departments has not been formally assessed—therefore, caution should be exercised when interpreting these data. In addition, the AIHW’s National Non-admitted Patient Emergency Department Care Database (NNAPEDCD) does not include all emergency department activity in remote areas and this is likely to affect reporting of data for Indigenous Australians who account for a higher proportion of the population in these areas [5]. Given this statement, all states and territories consider the Indigenous status data to be of a quality appropriate for publication.
In particular, two new codes were introduced to capture data about COVID-19 presentations – one where COVID 19 has been confirmed by laboratory testing and another when COVID-19 has been clinically diagnosed, but laboratory testing is inconclusive, not available or unspecified [6]. In the PHIDU data workbooks and maps presenting data by diagnosis (in the ‘ED_diagnosis’ tab), presentations allocated to these codes are included in the ‘Emergency department presentations: Total presentations for other diseases/conditions’ column.
References
Australian Institute of Health and Welfare (2022) Australia's hospitals at a glance 2022.
Ford G. The role of the Emergency Department as a 'safety net'. Health Issues 2002;73:29-32.
Australian Institute of Health and Welfare (AIHW). Australian hospital statistics 2011-12. Health services series no. 50. (Cat. no. HSE 134.) Canberra: AIHW; 2013.
Australian Institute of Health and Welfare (AIHW). Access to primary health care relative to need for Indigenous Australians. Cat. no. AIHW 128. Canberra: AIHW; 2014
Australian Institute of Health and Welfare (AIHW). Emergency department care 2017–18: Australian hospital statistics. Health services series no. 89. Cat. no. HSE 216. Canberra: AIHW; 2018
Australian Institute of Health and Welfare (AIHW). Emergency department care 2018–19: Australian hospital statistics. Appendix A. Canberra: AIHW; 2019.
Caveat: Although there are national standards for data on non-admitted patient ED services, the way those services are defined and counted varies across states and territories [5]. One of the most notable variations is the very large number of hospitals in New South Wales with ED services categorised as ‘Other hospitals’. All but one of the 87 hospitals in this category providing ED services were in New South Wales; in comparison, the large majority of public acute hospitals providing ED services in other states and territories were in one of the categories of Public acute hospitals Group A, B or C (see Appendix C, Table A3 [5]).
Hospitals in the ‘Other hospitals’ category tend to have a greater proportion of non-acute separations compared with the larger public acute hospitals [5]. These variations become particularly evident when viewing the data by small geographic area across Australia./p>
In addition, there is also considerable variation in access to ED services within the States and Territories. As a result, while comparisons between capital cities are appropriate, comparisons between areas outside of capital cities between the states and territories should not be made. To assist users in relating variations in rates of presentations to issues of access, the interactive atlases include the locations of the hospitals with ED facilities. These facilities were geocoded from the listing reported by the Australian Institute of Health and Welfare [5]. In 2018/19, Western Australia commenced reporting for 6 Public acute group C hospitals in Western Australia [7]. It should be noted that while every effort is made by the government agencies to incorporate cross state/territory border movements of patients in the dataset, some data anomalies do occur since the reported location is based on a persons' area of residence.
The variation in the provision of Emergency Department services by capital city and rest of state/territory to Indigenous people
The extent of variation in the provision of Emergency Department services counted in this collection is shown in Table 2, where the age-standardised rate of presentations for Australia has been set as 100, and the rates in the capital cities and Rest of State/ NT areas (the areas outside of the capital cities) are shown as an index number relative to the Australian rate.
Some highlights from the table are noted below.
For capital cities:
Total presentations were 21% below the national rate,
Non-urgent presentations were 57% below the national rate,
the range for Total presentations is from 58% below the national rate in Hobart, 25% below in Sydney and 33% below in Melbourne to 27% above in Darwin,
the range of Resuscitation and Emergency presentations is from 79% above in Darwin, 14% above in Adelaide to 23% and 65% below in Melbourne and Hobart, respectively,
for Urgent presentations , the range is from 59% below in Hobart, around 18% below in Sydney to 13% above in Darwin,
for Semi-urgent presentations , the range is from 57% below in Hobart, 49% below in Brisbane to 42% above in Darwin, and
for Non-urgent presentations , all capital cities were below the national rate.
For Rest of states/ NT:
Total presentations were 12% above the national rate,
the range for Total presentations is from 48% below the national rate in Rest of Tasmania to 73% above in Rest of Western Australia,
the range of Resuscitation and Emergency presentations is from 49% above in the Rest of Northern Territory to 67% below in the Rest of Tasmania,
for Urgent presentations , the range is from 48% below the national rate in Rest of Tasmania to 27% above in Rest of Northern Territory,
for Semi-urgent presentations , the range is from 40% below in the Rest of Queensland to 96% above for the Rest of Western Australia and
for Non-urgent presentations , from 69% below in Rest of Queensland to 95% above in Rest of New South Wales and 185% above in the Rest of Western Australia.
Table 2: Variations in age-standardised rates, expressed as an index, of Emergency Department presentations for Indigenous people, 2017/18. (Australia = 100).
Emergency Department presentations by Chapter and Triage category for Indigenous people
The dataset was split by ICD-10-AM Chapter and triage category (Table 3) to create 33 indicators by ICD-10-AM Chapter and Triage category. The ICD-10-AM chapter is categorised from the ICD-10 codes as reported in each patient's principal diagnosis. The Triage category is assigned to a patient by the ED to indicate the urgency of the patient’s need for medical and nursing care.
Table 3 shows the distribution and number of records used to create the atlases (in bold) by ICD-10-AM Chapter and Triage categories. To achieve the numbers required to present information without a large degree of confidentialisation at the IARE level, certain Triage categories were aggregated together.
Table 3: Emergency Department presentations by ICD-10-AM Chapter and Triage category for Indigenous people, 2018/2019
ICD-10-AM Chapter
Resuscitation and Emergency (within 10 minutes)
Urgent (Within 30 minutes)
Resuscitation, Emergency and Urgent Presentations
Semi-Urgent (Within 60 minutes)
Non-urgent (within 120 minutes)
Semi-urgent and Non-urgent (within 120 minutes)
Total
Certain infectious and parasitic diseases
-
-
13,561
-
-
14,230
27,791
Mental and behavioural disorders
-
-
20,917
-
-
12,540
33,457
Diseases of the circulatory system
-
-
10,970
-
-
-
13,268
Diseases of the respiratory system
10,921
24,594
-
-
-
20,061
55,576
Diseases of the digestive system
-
-
15,288
-
-
15,326
30,614
Diseases of the musculoskeletal system and connective tissue
-
-
8,554
-
-
19,478
28,032
Diseases of the genitourinary system
-
-
11,226
-
-
8,743
19,969
Injury, poisoning and certain other consequences of external causes
11,930
34,031
-
66,127
17,664
-
129,752
Factors influencing health status and contact with health services
Detailed information on the Emergency Department dataset
The data presented are sourced from the AIHW’s National Non-admitted Patient Emergency Department Care Database (NNAPEDCD), which is based on the Non-admitted Patient Emergency Department Care (NAPEDC) National Minimum Data Set/National Best Endeavours Data Set (NMDS/NBEDS). The NNAPEDCD provides information on the care provided for non-admitted patients registered for care in EDs in public hospitals where the ED meets the following criteria:
a purposely designed and equipped area with designated assessment, treatment, and resuscitation areas
the ability to provide resuscitation, stabilisation, and initial management of all emergencies
availability of medical staff in the hospital 24 hours a day
designated emergency department nursing staff 24 hours per day 7 days per week, and a designated emergency department nursing unit manager.
Emergency departments (including ‘accident and emergency’ or ‘urgent care centres’) that do not meet the criteria above are not in scope for the NMDS, but data may have been provided for some of these by some states and territories [2].
The coverage of the NNAPEDCD was considered complete for public hospitals which meet the above criteria. The collection does not include all emergency services provided in Australia; for example, emergency service activity provided by private hospitals, or by public hospitals which do not have an ED that meets the above criteria are excluded. This should be taken into account, particularly when comparing data between urban and regional areas, or by Remoteness Area. States and territories provided Emergency Department diagnosis information in several classifications, including SNOMED CT-AU, International Classification of Diseases, 9th Revision, Clinical Modification (ICD-9-CM); and various editions of ICD-10-AM. For the purpose of reporting principal diagnoses, the AIHW mapped the provided information to ICD-10-AM 10th edition codes, where necessary.
Any of the reported principal diagnosis as per the below:
A00–B99 (Certain infectious and parasitic diseases)
F00–F99 (Mental and behavioural disorders)
I00–I99 (Diseases of the circulatory system)
J00–J99 (Diseases of the respiratory system)
K00–K93 (Diseases of the digestive system)
M00–M99 (Diseases of the musculoskeletal system and connective tissue)
N00–N99 (Diseases of the genitourinary system)
S00–T98 (Injury, poisoning and certain other consequences of external causes)
Z00–Z99 (Factors influencing health status and contact with health services).
Confidentiality of data: Counts of less than 5 presentations have been suppressed.
Specific Indigenous Areas within Queensland have been aggregated on the request of Queensland Health; data displayed are the combination of values and rates for these aggregated areas.
Geography: Data available by Indigenous Area, Primary Health Network, Quintile of socioeconomic outcomes (based on IRSEO) and Remoteness Area
Numerator: Presentations by Aboriginal people to Emergency Departments for above categories.
Denominator: ABS estimated resident population (produced as a consultancy for PHIDU), 30 June 2021.
Detail of analysis: Indirectly age-standardised rate per 100,000 Indigenous population; and/or indirectly age-standardised ratio, based on the Australian standard derived from an Indigenous population. A standardised ratio (SR) provides a comparison to the Australian rate which is assigned a value of 100. Ratios below 100 are proportionally less than the national rate, while ratios above 100 are proportionally higher than the national rate. The SR is the ratio of the observed value to the expected value (the expected value is age-standardised).
Source: Compiled by PHIDU using data from the Australian Institute of Health and Welfare, supplied on behalf of State and Territory health departments for 2020/21; and ABS estimated resident population (produced as a consultancy for PHIDU), 30 June 2021.
 Back to Torrens