Figure 1: Emergency department presentations for a mental-health related condition, selected age groups, by quintile of socioeconomic disadvantage or area, Australia, 2018/19
| Measure of disadvantage1 |
0 to 14 years |
15 to 24 years |
25 to 64 years |
65 years and over |
All ages |
| Q1: Least disadvantaged |
192.09 |
1,273.99 |
856.82 |
789.35 |
770.80 |
| Q2 |
213.27 |
1,486.19 |
1,070.05 |
919.95 |
933.10 |
| Q3 |
222.85 |
1,574.63 |
1,251.80 |
940.31 |
1,053.10 |
| Q4 |
271.97 |
1,982.35 |
1,758.54 |
1,003.58 |
1,373.50 |
| Q5: Most disadvantaged |
333.20 |
2,297.37 |
2,192.02 |
1,077.5 |
1,655.20 |
| Rate ratio |
1.73 |
1.80 |
2.56 |
1.37 |
2.15 |
1Quintiles of socioeconomic disadvantage: for details see here.
Figure 3: Change by month in ED presentations for mental health-related conditions, by age groups: 2016/17 to 2020/21, South Australia
Population aged 0 to 4 years
| Year |
Pop 0 to 4 years |
Rates |
|
|
|
|
|
|
|
|
|
|
|
|
|
|
Jul |
Aug |
Sep |
Oct |
Nov |
Dec |
Jan |
Feb |
Mar |
Apr |
May |
Jun |
Total FY |
| 2016/17 |
102,468 |
0.88 |
0.78 |
0.59 |
0.88 |
0.68 |
0.59 |
1.17 |
0.88 |
1.07 |
0.88 |
0.49 |
- |
8.88 |
| 2017/18 |
101,135 |
1.09 |
- |
0.69 |
1.09 |
0.69 |
- |
0.99 |
0.49 |
- |
0.59 |
- |
0.59 |
6.23 |
| 2018/19 |
99,915 |
0.60 |
- |
0.50 |
0.50 |
0.70 |
0.50 |
0.50 |
0.50 |
- |
0.60 |
- |
0.80 |
5.20 |
| 2019/20 |
98,918 |
0.61 |
- |
- |
- |
- |
0.81 |
- |
0.51 |
- |
- |
- |
- |
1.92 |
| 2020/21 |
99,781 |
- |
0.60 |
0.50 |
0.50 |
- |
0.60 |
- |
0.80 |
0.60 |
0.70 |
- |
0.80 |
5.11 |
Note: The 0 to 4 year age group was not charted as there are too many missing values, and low rates based on small numbers.
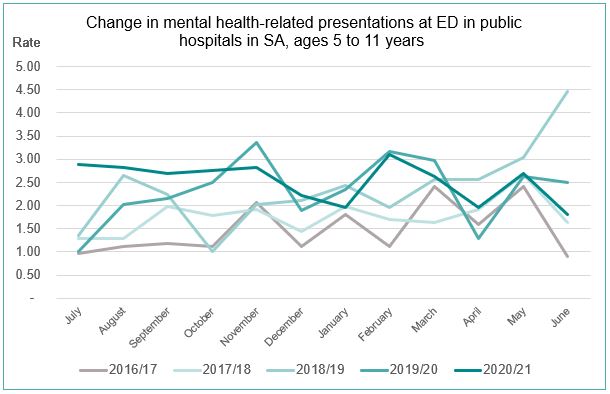
Population aged 5 to 11 years
| Year |
Pop 5 to 11 years |
Rates |
|
|
|
|
|
|
|
|
|
|
|
|
|
|
Jul |
Aug |
Sep |
Oct |
Nov |
Dec |
Jan |
Feb |
Mar |
Apr |
May |
Jun |
Total FY |
| 2016/17 |
144,593 |
0.97 |
1.11 |
1.18 |
1.11 |
2.07 |
1.11 |
1.80 |
1.11 |
2.42 |
1.59 |
2.42 |
0.90 |
17.77 |
| 2017/18 |
146,399 |
1.30 |
1.30 |
1.98 |
1.78 |
1.91 |
1.43 |
1.98 |
1.71 |
1.64 |
1.91 |
2.66 |
1.64 |
21.24 |
| 2018/19 |
147,690 |
1.35 |
2.64 |
2.23 |
1.02 |
2.03 |
2.10 |
2.44 |
1.96 |
2.57 |
2.57 |
3.05 |
4.47 |
28.44 |
| 2019/20 |
148,511 |
1.01 |
2.02 |
2.15 |
2.49 |
3.37 |
1.89 |
2.36 |
3.16 |
2.96 |
1.28 |
2.63 |
2.49 |
27.81 |
| 2020/21 |
148,790 |
2.89 |
2.82 |
2.69 |
2.76 |
2.82 |
2.22 |
1.95 |
3.09 |
2.62 |
1.95 |
2.69 |
1.81 |
30.31 |
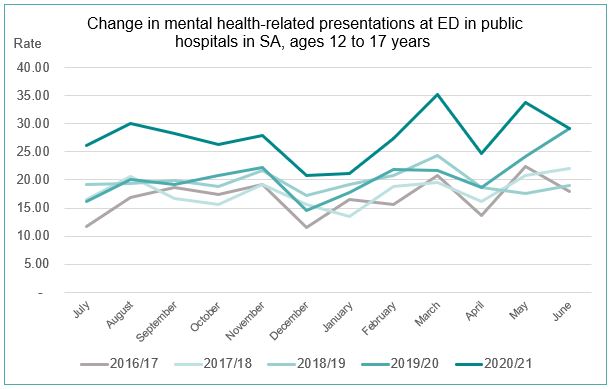
Population aged 12 to 17 years
| Year |
Pop 12 to 17 years |
Rates |
|
|
|
|
|
|
|
|
|
|
|
|
|
|
Jul |
Aug |
Sep |
Oct |
Nov |
Dec |
Jan |
Feb |
Mar |
Apr |
May |
Jun |
Total FY |
| 2016/17 |
118,904 |
11.77 |
16.90 |
18.67 |
17.41 |
19.26 |
11.61 |
16.57 |
15.64 |
20.77 |
13.71 |
22.37 |
17.91 |
202.6 |
| 2017/18 |
118,977 |
16.56 |
20.68 |
16.64 |
15.63 |
19.25 |
15.55 |
13.53 |
18.74 |
19.58 |
16.22 |
20.84 |
22.11 |
215.34 |
| 2018/19 |
119,937 |
19.18 |
19.34 |
19.84 |
18.84 |
21.76 |
17.26 |
19.26 |
20.76 |
24.43 |
18.68 |
17.51 |
18.93 |
235.79 |
| 2019/20 |
121,755 |
16.10 |
20.04 |
19.22 |
20.86 |
22.18 |
14.54 |
17.82 |
21.93 |
21.68 |
18.64 |
24.15 |
29.07 |
246.23 |
| 2020/21 |
123,886 |
26.07 |
30.03 |
28.17 |
26.23 |
27.93 |
20.83 |
21.23 |
27.36 |
35.19 |
24.78 |
33.74 |
29.22 |
330.79 |
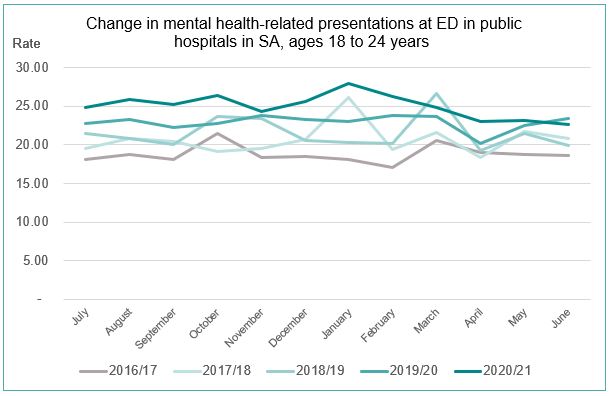
Population aged 18 to 24 years
| Year |
Pop 18 to 24 years |
Rates |
|
|
|
|
|
|
|
|
|
|
|
|
|
|
Jul |
Aug |
Sep |
Oct |
Nov |
Dec |
Jan |
Feb |
Mar |
Apr |
May |
Jun |
Total FY |
| 2016/17 |
158,544 |
18.04 |
18.80 |
18.10 |
21.51 |
18.29 |
18.48 |
18.10 |
17.09 |
20.50 |
18.99 |
18.73 |
18.67 |
225.3 |
| 2017/18 |
158,611 |
19.54 |
20.87 |
20.36 |
19.10 |
19.48 |
20.62 |
26.16 |
19.42 |
21.63 |
18.35 |
21.75 |
20.87 |
248.15 |
| 2018/19 |
158,934 |
21.39 |
20.76 |
20.07 |
23.59 |
23.34 |
20.57 |
20.26 |
20.20 |
26.68 |
19.32 |
21.39 |
19.88 |
257.47 |
| 2019/20 |
159,110 |
22.69 |
23.32 |
22.25 |
22.75 |
23.82 |
23.32 |
23.07 |
23.82 |
23.63 |
20.11 |
22.44 |
23.44 |
274.65 |
| 2020/21 |
158,020 |
24.81 |
25.88 |
25.25 |
26.33 |
24.36 |
25.63 |
27.97 |
26.20 |
24.87 |
22.97 |
23.16 |
22.66 |
300.09 |
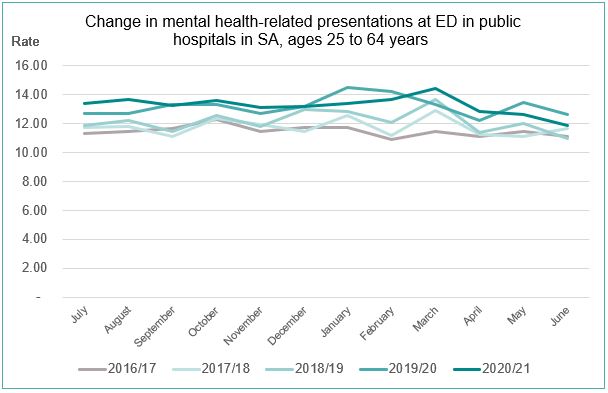
Population aged 25 to 64 years
| Year |
Pop 25 to 64 years |
Rates |
|
|
|
|
|
|
|
|
|
|
|
|
|
|
Jul |
Aug |
Sep |
Oct |
Nov |
Dec |
Jan |
Feb |
Mar |
Apr |
May |
Jun |
Total FY |
| 2016/17 |
886,695 |
11.29 |
11.45 |
11.65 |
12.26 |
11.44 |
11.72 |
11.74 |
10.89 |
11.42 |
11.10 |
11.46 |
11.07 |
137.49 |
| 2017/18 |
889,679 |
11.72 |
11.78 |
11.09 |
12.35 |
11.94 |
11.42 |
12.57 |
11.14 |
12.87 |
11.25 |
11.12 |
11.64 |
140.89 |
| 2018/19 |
894,108 |
11.89 |
12.18 |
11.45 |
12.52 |
11.80 |
12.99 |
12.85 |
12.05 |
13.67 |
11.39 |
12.01 |
10.99 |
145.78 |
| 2019/20 |
900,936 |
12.71 |
12.71 |
13.29 |
13.32 |
12.70 |
13.14 |
14.51 |
14.23 |
13.32 |
12.23 |
13.46 |
12.62 |
158.24 |
| 2020/21 |
901,252 |
13.40 |
13.67 |
13.23 |
13.59 |
13.08 |
13.14 |
13.36 |
13.64 |
14.38 |
12.80 |
12.63 |
11.88 |
158.8 |
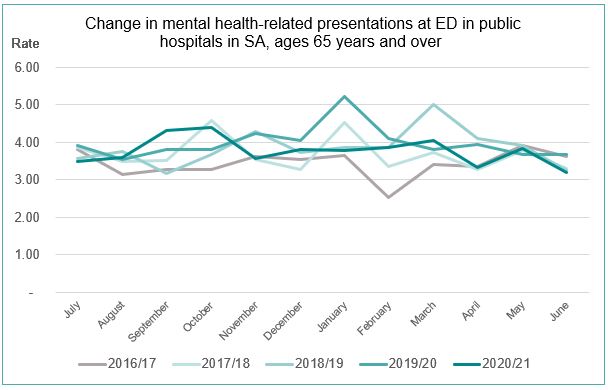
Population aged 65 years and over
| Year |
Pop 65 years and over |
Rates |
|
|
|
|
|
|
|
|
|
|
|
|
|
|
Jul |
Aug |
Sep |
Oct |
Nov |
Dec |
Jan |
Feb |
Mar |
Apr |
May |
Jun |
Total FY |
| 2016/17 |
307,180 |
3.81 |
3.16 |
3.29 |
3.29 |
3.61 |
3.55 |
3.65 |
2.54 |
3.42 |
3.35 |
3.91 |
3.61 |
41.18 |
| 2017/18 |
315,425 |
3.87 |
3.49 |
3.52 |
4.6 |
3.55 |
3.27 |
4.53 |
3.36 |
3.74 |
3.27 |
3.77 |
3.30 |
44.26 |
| 2018/19 |
324,022 |
3.58 |
3.77 |
3.18 |
3.67 |
4.29 |
3.73 |
3.86 |
3.86 |
5.00 |
4.10 |
3.92 |
3.24 |
46.2 |
| 2019/20 |
333,670 |
3.93 |
3.54 |
3.81 |
3.81 |
4.23 |
4.05 |
5.21 |
4.11 |
3.81 |
3.96 |
3.69 |
3.69 |
47.8 |
| 2020/21 |
341,038 |
3.49 |
3.61 |
4.31 |
4.40 |
3.58 |
3.81 |
3.78 |
3.87 |
4.05 |
3.34 |
3.84 |
3.20 |
45.27 |
 Back to Torrens