 Back to Torrens
Publications: 2005 to 2009
Emergency Department Presentations: identifying hotspots of inequality
A Geographic and Temporal Analysis
Published: July 2023
Purpose of the project
Public hospital emergency departments (ED) are a key element of the health system providing an essential gateway to health care for patients with acute or chronic conditions of differing severities for all ages of the Australian public. Mapping the geographic variation in the rates of ED presentations provides an area-based indicator that reflects the interaction between the demand for, and, supply of, health care services. Weber, 2017 suggests that ED visits can be used to detect and describe the health of our communities, their access to care and the resources they need. Extending the mapping this variation over time can highlight areas of concern, such as areas that are over- or under- serviced, prompting the need for further exploration to understand why some areas have high presentation rates or to investigate why in other instances rates are low. Given that the range in geographic variation in ED presentations can be large, a ‘one-size fits all’ approach by health policy to reducing this variation may not be the appropriate solution (Weber, 2017).
The presentations that make up the ED dataset comprises of a wide range of patient care pathways determined by clinical and non-clinical factors which vary across different geographic location across Australia. Because of these differences, we selected a range of indicators to represent this variation of ED utilisation that are commonly investigated in the policy and research realms in Australia.
Reporting on the rates of ED presentations over time are often calculated through direct age-standardisation when presentations are at the population level. If the variable is age-specific, presentation rates are calculated as crude presentation rates (i.e. age-specific presentations/age-specific population). When calculating age-standardised rates the occurrence of small numbers in terms of both the number of presentations and populations within each age group living in a small area means that the rates can be erroneously inflated. This approach becomes problematic when we want to identify areas that consistently have high presentation rates as areas that warrant intervention. To overcome this issue, we implemented the Empirical Bayes estimation method, within the direct age-standardisation process, to estimate presentation rates at the small area level for three years, 2017 to 2020, across Australia. This approach minimises the effects of statistical issues in the calculation of the ED presentation rates by weighing the presentation rate of an area together with the presentation rates from all areas under investigation.
Hotspot analysis was then undertaken on this dataset highlighting the heat of each area, from "Cold" to "Hot", in relation to the area’s annual presentation rate compared to the annual Australian average for the selected types of ED presentation. We provide a range of thresholds above and below the Australian average to investigate the sensitivity and persistence of these classifications over time.
It is important to note that the state of New South Wales and in particular their rural areas have a high rate of ED presentations. These high rates will bias the analysis towards these areas. This issue highlights the benefit of using the multiple heat threshold approach. Users whose regions are outside rural NSW may need to select lower heat thresholds to highlight the geographic and temporal persistence of ED presentations that are more appropriate for their regions of analysis.
The increasing trend in ED presentations over time (AIHW, 2023a) signifies that the ED is a focal point of care for many patients and a continuing pathway to hospital admission. The significant geographic inequalities of utilisation across Australia found by past research and the persistent call for locally tailored interventions warrant a more in-depth investigation into, not only the geographic variation but the temporal persistence of its utilisation across Australia. Identifying these distributions can help prioritise where alternative models of care or additional resources could be allocated to reduce this dependence on this form of health care.
We hope that this new analysis, and its presentation in geographical maps, heat map graphs and data sheet, will provide information that is useful to the various levels of the health system, from state and territory health agencies, local and regional health networks and boards, Primary Health Network (PHN) and primary care practitioners, with an aim to work together to gain a better understanding of the underlying issues that drive ED presentations. The interpretation of the data and its presentation is complex, and we encourage users to read the detailed notes below, and, to take note of the document on Using the Atlas.
Further information can be obtained by contacting the Public Health Information Development Unit.
Summary notes on emergency department presentations
The emergency department presentations atlas and corresponding data show the geographic and temporal variations in rates for different types of ED presentations. The analysis is described in detail below, but, in brief, each Population Health Area (PHA) is classified based on their annual presentation rates compared to the population weighted Australian average as being "Cold", "Cold-Warm", "Warm", "Warm-Hot" or "Hot". These classes can be viewed at different thresholds; for example, is the area “Hot” when compared with the average rate of presentations across Australia for a particular indicator across the three years? Or is it still “Hot”, when we change the threshold to a level 20% above the Australian rate?
By providing a selection of thresholds, we can investigate the persistence of these classifications in different PHAs over time. This can be done both between and within PHAs. Figure 1 provides an example showing the geographic and temporal variation in the heat of the ED presentations for the Total presentations ED category when presentation rates are compared to the Australian average.
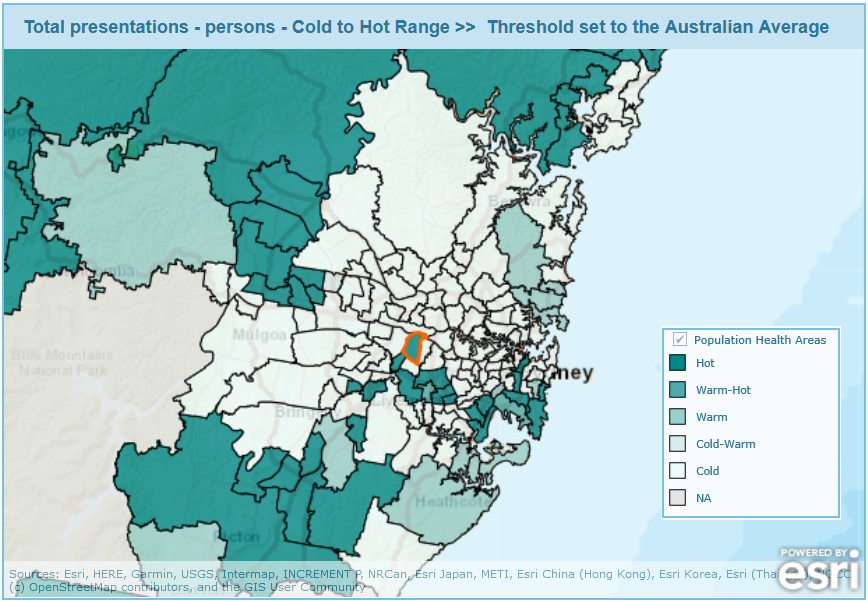
The map is focused on the distribution of heat across the small areas in the greater Sydney region in New South Wales. The figure shows that there are areas which persistently have presentation rates both over and under the Australian threshold (classified as "Cold" or "Hot") and that these areas are often clustered together. In addition, the variations in heat over the three-year period within each PHA can be investigated by different types of ED presentations using the heat map graphs. For example, we have selected the Granville – Clyde/Guilford – South Granville PHA (Figure 2).
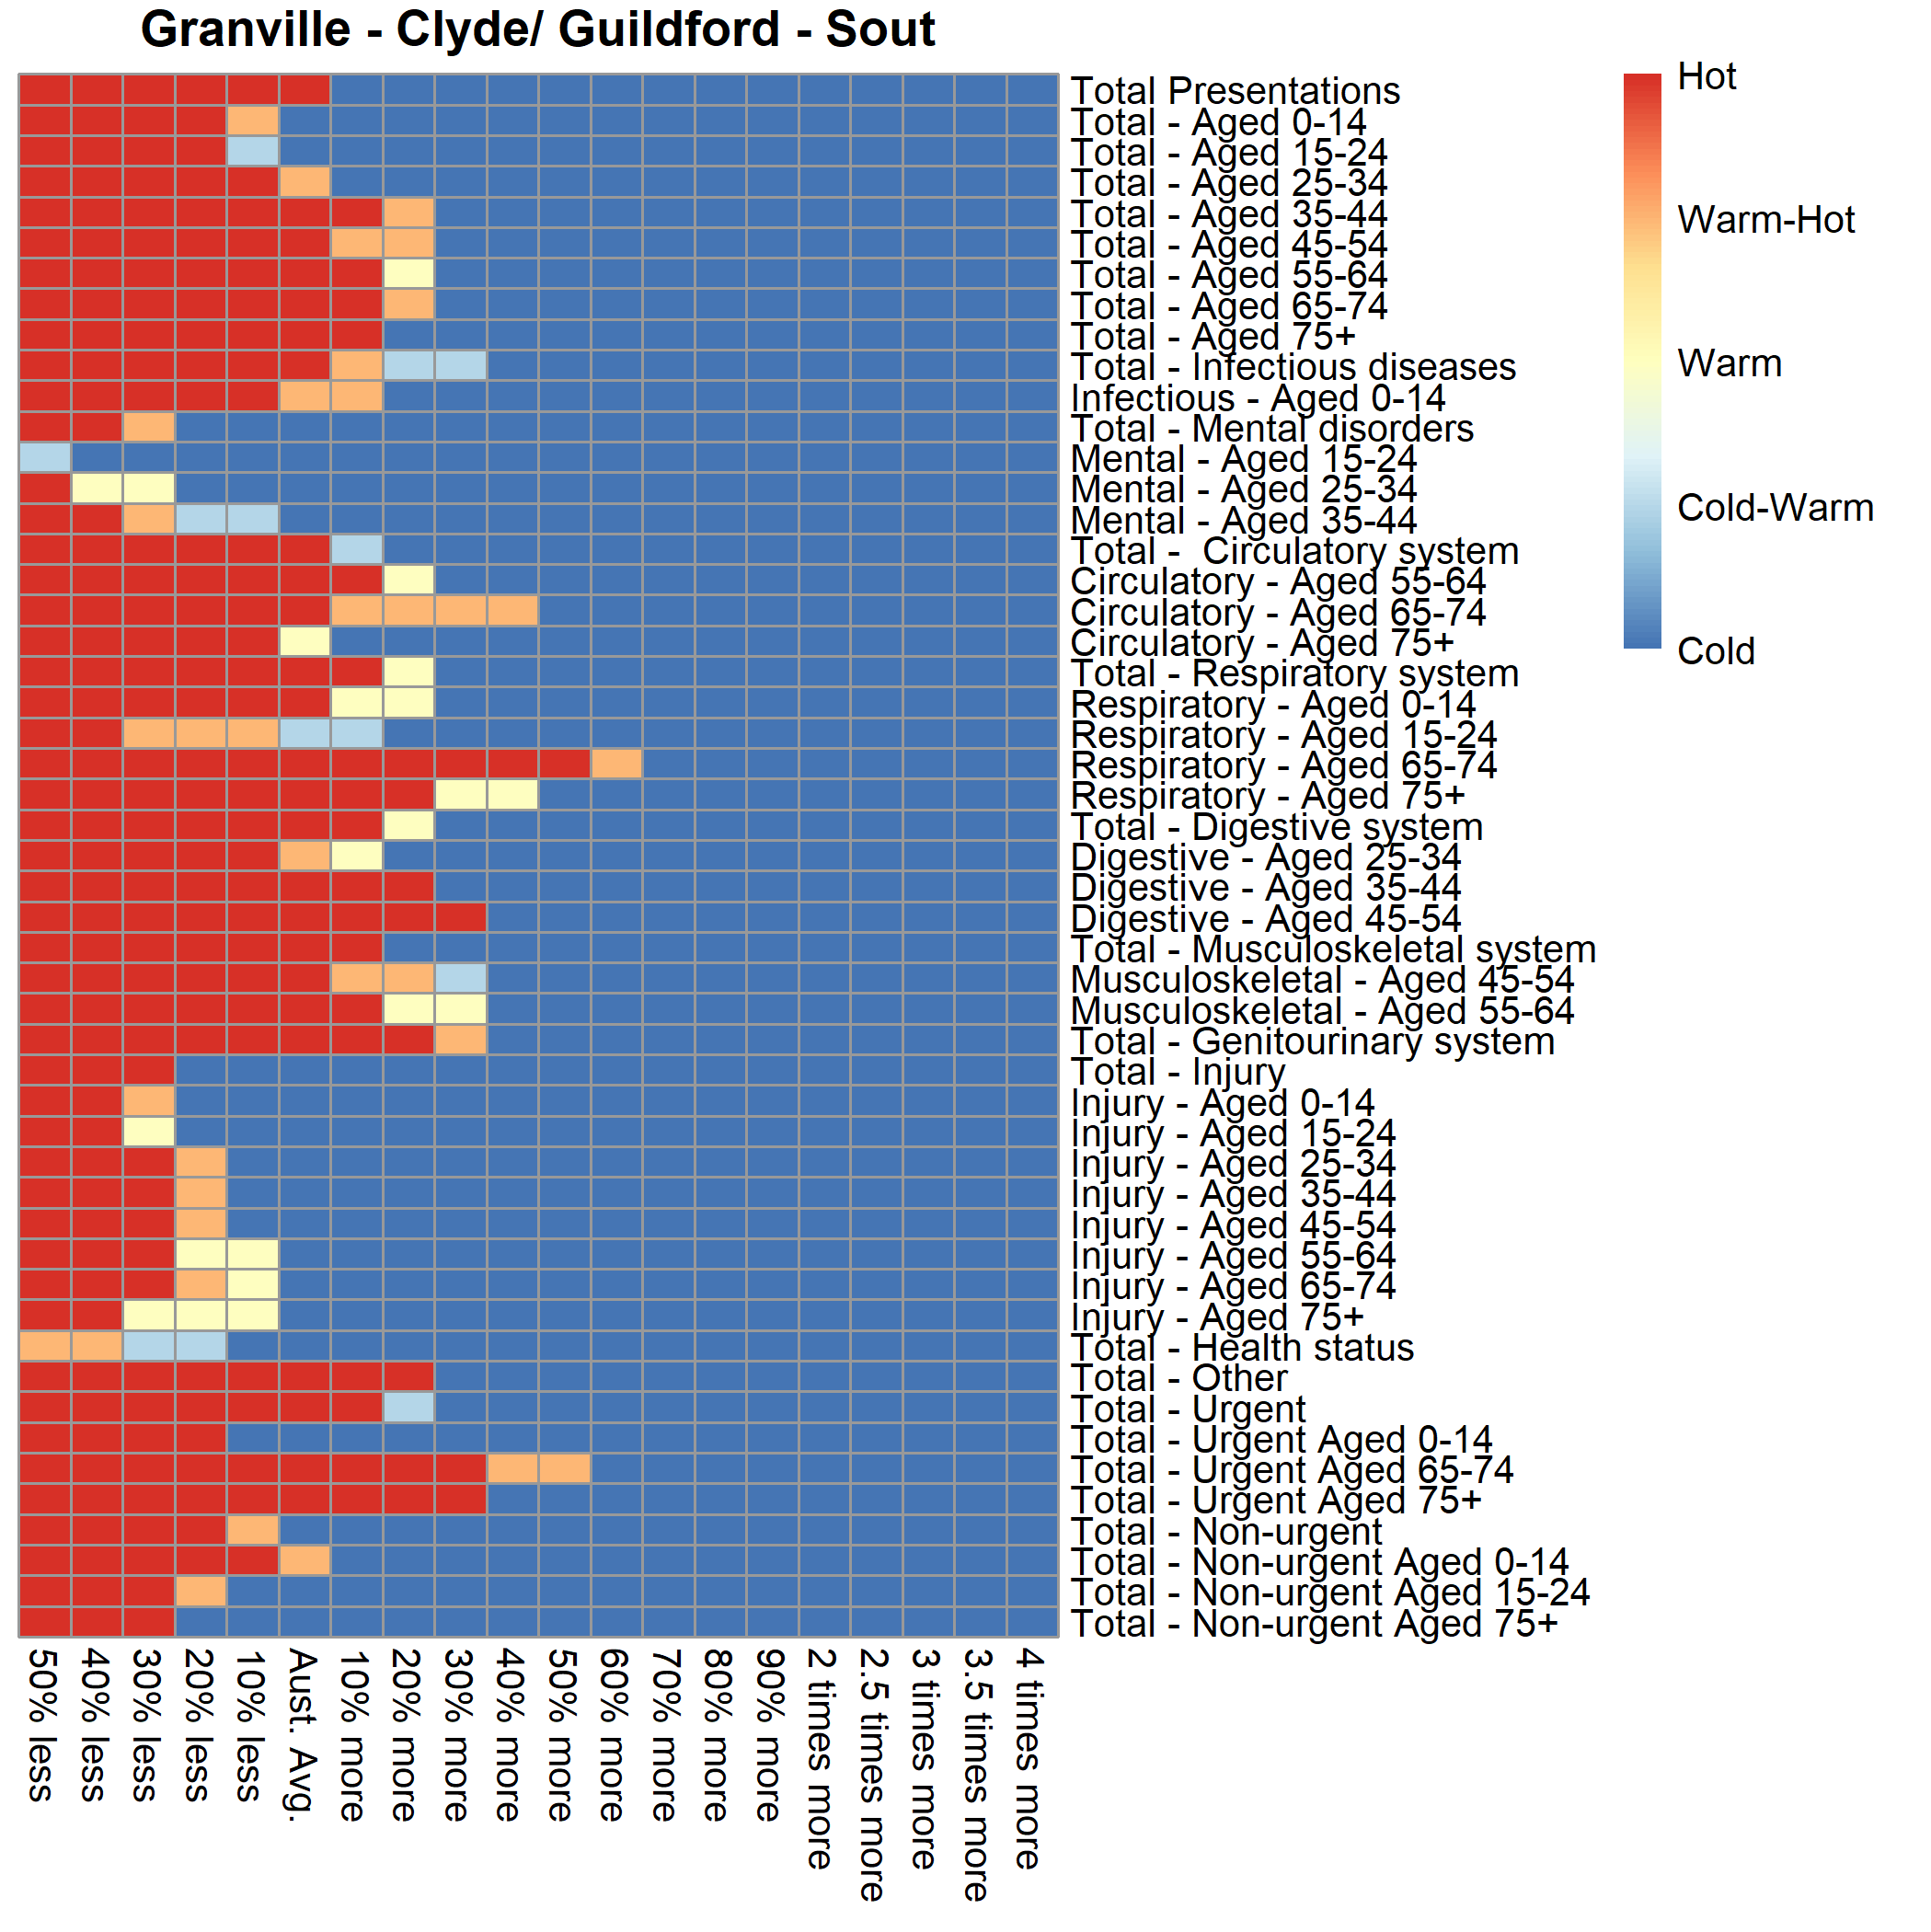
The graph shows the range of heat for the different types of ED presentations for the series of selected thresholds showing the degree of variation of ED utilisation by people living within this PHA. ED presentations were designated as "Hot" when the threshold was set to 20% more than the Australian average for:
- Diseases of the Respiratory system category for those aged 65 to 74 years old and 75 years plus category.
- Diseases of the Digestive system category for those aged 35 to 44 and 45 to 54 years old categories.
- Diseases of the Genitourinary system category.
- Presentations classified as Urgent for those aged 65 to 74 years old and 75 years plus categories.
Rates of presentations over time were below the Australian average for other types of ED presentations. The graphs can also be used to compare the magnitude of rates of utilisation of ED services between PHAs.
Analysing the temporal trend by type of ED presentation category provides an overview of the distribution of the overall rates ED presentations in Australia. It is worth noting that these categories are an aggregate of individual presentations. This suggests that, once this complexity is unpacked, different strategies will need to be implemented to effect change. We must also highlight that when specific indicators are investigated, the number of presentations by PHA may become small. Thus, we suggest that you use these data with caution; it may also be useful to refer to the number of presentations in any PHA, available in the emergency department presentations atlas and corresponding data .
Background and aim of the project
Public hospital emergency departments (ED) are a key element of the health system providing a time critical care role as a safety net of health care, 24 hours a day, seven days a week and without cost. The ED provides differing health care options to patients. It can provide a first or only point of contact for care due to combinations of patient preference, unavailability of other health services or lack of need for ongoing care after the ED presentation. Alternatively, it can act as a gateway of care as an admitted patient to a hospital, or to other specialised or ongoing health care (AIHW, 2014).
ED presentations are made up of a range of people who seek care. These range from:
- those who occasionally seek care for unexpected acute health problems and events.
- those who suffer from chronic disease who ask for care when the disease reaches a critical stage.
- those who perceive EDs as a source of primary care.
- those that have regular multiple presentations (frequent attenders).
Reasons for geographic variation in ED presentations
Geographic variation in the rate of ED presentations reflect the interactions of the relative need and choice of services by the patient and the supply and availability of health care services to the patient in different geographic regions of Australia.
Geographic remoteness and socio-economic disadvantage
Two major drivers of the interactions between relative need and choice of services by the patient and the supply and availability of health care services to the patient are the geographic remoteness and socio-economic disadvantage related to the area in which the patient lives.
Geographic Remoteness
Data for Australia published by PHIDU for 2019/20 show that there are large ratios for ED presentations between areas in Very Remote regions and areas in Major Cities regions. For example, ratios of 2.29 for the Total ED presentation category and 4.87 for the Non-Urgent ED presentation category have been reported. This data and other types of ED presentations broken down by remoteness can be found here.
Socio-economic Disadvantage
The increasing trend, apparent in remote areas of Australia, is also apparent in areas that have higher levels of social disadvantage. These are areas with a greater proportion of people with low incomes, low educational attainment, high unemployment and jobs in relatively unskilled occupations. Data for Australia published by PHIDU for 2019/20 show that the ratio of ED presentations for people living in most disadvantaged to least disadvantaged areas was 1.82 for the Total ED presentation category and 1.72 for Non-Urgent ED presentation category. This data and other types of ED presentations by levels of disadvantage can be viewed here. These trends are similar for most areas within different State and Territory areas, however, sometimes there are exceptions. For example, in Sydney a reverse trend is evident. Rates in the Non-Urgent ED presentations category were 35% higher in the least disadvantaged areas when compared to those rates in the most disadvantaged areas.
The fragmented delivery of primary care across Australia
The Australian healthcare system is structured to provide universal coverage of medical services, public hospitals and medicines for all residents with aims to provide equitable, accessible, safe, high‐quality healthcare to the population (DoHAC, 2019). Accessibility to affordable medical services such as primary care plays an important part in the health of the nation. However, there is currently no definitive measure or indicator of access to affordable general practice which makes the measurement, analysis, appraisal and evaluation of this issue difficult. Some datasets can explain part but not all of the issue. This is due to the nature of seeing a GP which reflects the geographic variation in the demand and supply of GP services across Australia (McRae and Bulter, 2014; Mu et al., 2020). A patient must firstly find a GP and this depends on the patient’s and GP’s physical location. Once finding a GP, a patient then must find an appointment with that GP. Once an appointment can be scheduled, it must be determined if the appointment is under bulk billing arrangements so that its fee -free or if a fee is payable is it affordable to the patient? Presentation to the ED will become an option to patients when access to affordable primary care is limited. A patient experience survey (ABS, 2019) found that around 21% of respondents reported a GP was not available when required. This issue was more apparent for people living in outer regional, remote or very remote areas where nearly 30% were more likely to report visiting an ED because a GP was not available when required than those living in major cities (17.8%) (ABS, 2019).Across Australia there is large regional variation in the physical access to General Practitioners (GPs). Past studies have illustrated this by using the Australian Bureau of Statistics remoteness categories as a regional breakup of Australia and the GP full-time equivalent as an indicator for GP accessibility. Here, one GP full-time equivalent (GP FTE) equates to 40 hours per week for 46 weeks of the year reflecting the primary care workload of Australia’s GP workforce (DoHAC, 2023). The number of GPs, available in 2020, were higher in major cities category (117.3 GP FTE per 100,000 population) compared to inner regional (114.3), outer regional (99.2), remote (78.8) and very remote (66.4) categories (Productivity Commission, 2022). The national rate, for the aggregation of the outer regional, remote and very remote categories, was 94.3 GP FTE per 100,000 population (Productivity Commission, 2022). The lack of a presence of GPs in these areas, demonstrated by lower numbers of GP FTEs, makes accessing primary care more difficult. Additionally, there is also within state variations, particularly in regions outside of metropolitan areas. Rates for the combined areas of outer regional, remote and very remote categories vary from 80.8 GP FTE per 100,000 population in Western Australia which is below the national average compared to 106.6 GP FTE per 100,000 population in Queensland which is above the national average.
The physical number of GPs that are available to the patient is one factor that affects the ability of patients to access primary care, another is whether there are actual appointments available. Clearly, the geographic variation in locations of GP’s dictates the geographic variation in the number of appointments available. Observations reported from the Northern Queensland Primary Health Network (PHN) (Health Policy Analysis, 2020) suggest that many practices were no longer accepting new patients leaving individuals with limited or no access to a regular GP in certain areas of their health catchment area. Two studies have demonstrated using a phone interview census (‘secret shopper’) method to understand the range of geographic variation that is apparent across their study areas to acquire real-time and same day GP appointments for new patients. The first study based its analysis on practices located in the inner and outer urban and regional areas of Melbourne (Freed et al., 2015). The second in the regional local government areas across north eastern NSW (Bradbury et al., 2017). Both studies showed vastly contrasting results between and within their study areas highlighting the inter- and intra-regional variability in obtaining a GP appointment. Within the Melbourne based study, appointments were generally available, with 78% of practices offering same-day access. Conversely, in the study based in north eastern NSW, the rate of same day availability for new patients was 47.5% with a large range of same day appointment availability across the study regions local government areas, from 11% to 61.5%. In this study area and at the time/year of data collection, a new adult patient had a 70% chance of getting an appointment with a GP within two weeks but a 30% chance of not seeing anyone.
An additional aspect of availability is affordability, namely whether these appointments are fee-free under the Australian government’s bulk-billing arrangements. Affordability of care is a significant issue and often leads to the skipping of medication doses and pathology tests as well as foregoing appointments with GPs especially among people with chronic disease and those experiencing financial stress (Zurynski et al., 2021). Patient experience surveys in Australia by small geographic areas in 2019-2020 (AIHW, 2021) show the percentage of people that forego appointments varied across Australia at the Primary Health Network level. The percentage of adults who delayed seeing a GP because of cost ranged from 2% in the central and eastern suburbs of Sydney to 9% in the Murray area.
When affordability is defined using data from the National Medicare Benefits Schedule, over 85% of services were reported as bulk billed with no-out of-pocket expenses, however, bulk billing behaviour varied by state, rurality and practice size (O’Sullivan et al., 2022). In 2019, bulk billing rates were highest in the NSW (89%), lowest in the ACT (64%) and Tasmania (75%) with other states clustered around the 85% average. National estimates of general practice attendances that were bulk billed showed an increasing rate from 2012 to 2019 with the magnitude varying by rurality. The lowest rates were in regional centres rising from 76% to 82% in 2019 with higher rates in metropolitan areas (83% in 2012 to 87% in 2019). The highest rates were reported in very remote communities (89 to 91%). While regional variation in affordability can be highlighted using services data, this use underplays the situation with an important distinction between the proportion of GP services that are bulk billed (those above) and the proportion of patients who always have their GP consults bulk billed (Tsirtsakis, 2022). The percentage for those who always have their GP consults bulk billed, for the year 2021-22 excluding temporary COVID-19 Vaccines items, for Australia was around 64% while those that are usually bulk billed was 20%, sometimes bulk billed was 8% and never bulk billed was 7% (DoHAC, 2023a). This rate varied across Australia at the Primary Health Network level with the range from 38% of patients in the ACT PHN always bulk billed and 20% never bulk billed to 91% always bulk billed and 1% never bulk billed in South Western Sydney PHN (DoHAC, 2023b). It must be noted that the use of GP bulk billing rates is contentious as frequent GP users could account for the major share of bulk-billing services leaving other people to pay out of pockets costs to access primary care (Ackermann, 2016).
Observations from three PHNs suggest that there was limited access to bulk-billing general practices which provides an additional constraint in the access to primary care (Health Policy Analysis, 2020). In their interview-based study on same day appointment availability, Freed et al., 2015 found around 75% of practices in the Melbourne-based study area offered bulk billing services. In comparison, the study in north eastern NSW (Bradbury et al., 2017) found that around 21% of all GP practices provided bulk billing with a range across local government areas of 0% to 50%. Extending this methodology to potentially all of Australia, a recent report (Cleanbill, 2023) on the number of general practices offering bulk billing showed that on average 35.1% of GP clinics bulk billed with around 9% of practices not taking on new patients. Rates of bulk billing were higher in capital cities than in other areas (Table 1). Further analysis across Australia (Cleanbill, 2023a) investigated the state-wide bulk billing rates in 504 postcodes that contained three or more GP clinics that were taking on new patients. In the analysis, postcodes were classified into postcodes where no GP clinics were taking on new patients bulk billed (“0% Bulk Billing Postcodes”), postcodes where 50% or more GP clinics were taking on new patients bulk billed (“>50% Bulk Bill Postcodes”) and postcodes where all GP clinics were taking on new patients bulk billed (“100% Bulk Billing Postcodes”). Table 1 shows the large variation in bulk billing across Australia and the inherit variation at the smaller postcode level within capital cities, Tasmania and the two main-land territories.
| Region Type | Clinics Listed (n) | Bulk Billing Rate (%) | Number of Postcodes | 0% Bulk Billing Postcode | >50% Bulk Billing Postcode | >100% Bulk Billing Postcode |
| National | 6,363 | 35.1 | 504 | 27.4 | 38.1 | 7.5 |
| National * | 4,188 | 42.7 | ||||
| NSW | 2,187 | 49.0 | ||||
| Greater Sydney | 1,198 | 67.3 | 143 | 14.0 | 66.4 | 21.0 |
| Victoria | 1,553 | 34.6 | ||||
| Greater Melbourne | 1,057 | 39.0 | 134 | 28.4 | 35.1 | 3.0 |
| Queensland | 1,321 | 26.5 | ||||
| Greater Brisbane | 573 | 29.8 | 78 | 21.8 | 32.1 | 2.5 |
| Western Australia | 616 | 26.6 | ||||
| Greater Perth | 463 | 29.2 | 70 | 35.7 | 14.3 | 2.9 |
| South Australia | 429 | 24.2 | ||||
| Greater Adelaide | 291 | 27.8 | 49 | 40.8 | 28.6 | 0 |
| Tasmania | 128 | 6.9 | 8 | 50.0 | 0 | 0 |
| Australian Capital Territory | 92 | 5.5 | 17 | 76.5 | 0 | 0 |
| Northern Territory | 37 | 20.6 | 5 | 20.0 | 20.0 | 0 |
*- covering 70% of Australia's population including each of Australia’s capital cities, Tasmania, the Australian Capital Territory and the Northern Territory.
Low access to bulk billing-only GPs has also been found at the ABS defined Statistical Area Level 2 (SA2) level. Around 55.2% of SA2s had no access to bulk billing-only practices which serviced 42.5% of the Australian population (Graham et al., 2023). Where access was possible, the national average was one practice to 8,529 people. The national study found no association between the distribution of bulk billing-only services and area-based socioeconomic status yet results described substantial access issues in some Australian states with higher numbers of lower socio-economic regions. This result was similar to another study which found only a small but pro-rich inequality in the probability of bulk-billed GP visits (Pulok et al., 2020).
The urgency of the ED presentation
Urgent ED Presentation Type
The patient experience survey (ABS, 2019) reports that nearly half the presentations to the ED are taken by ambulance or were serious in nature. These presentations are more likely to be better managed in the ED rather than through primary care due to a range of barriers such as funding models and logistics, workforce and training requirements, medicolegal obligations, and care coordination (Willson et al., 2022). Aggregated data by presentation urgency (PHIDU, 2023) illustrate that higher rates of presentation and subsequent admission to hospital for urgent conditions seem to justify their need for initial ED assessment and management. However, those patients requiring admission to inpatient beds with complex healthcare needs are seen as a health care system priority (Dinh et al., 2015) as they contribute substantially to the increase in ED presentations and place a significant threat to existing ED resources (Morley et al., 2018).
One important issue within this urgent category has been found in the presentations from older persons. This cohort of the population have more complex health conditions often with comorbidities, are frail, have cognitive and functional impairments and are on multiple medications (polypharmacy). EDs are often poorly equipped to address the multi-dimensional nature of patient need and the complex circumstances surrounding repeated presentations (Baird et al., 2021). Older persons that present with acute illnesses have been found to be more likely admitted to hospital (Aboagye-Sarfo et al., 2015; Dinh et al., 2015) compared to those who presented with chronic conditions who were more likely to be not admitted (Fry et al., 2018) which suggests that primary care may be a better place for their health care. Identifying the geographic trends in ED presentations within the urgent presentation category will help identify which models of care require additional strengthening of resources and provide some insights into potential alternative pathways of care.
Less Urgent ED Presentation Type
A large proportion of ED presentations are for conditions of less urgency with about one third of all ED presentations classified as lower urgency and close to half of all lower urgency ED presentations were for people aged under 25 (AIHW, 2020). The patient experience survey (ABS, 2019) highlights that one in six people (16.8%) who visited the ED thought care could have been provided by a General Practitioner (GP) for their most recent presentation. Additionally, it reports that 47.1% reported that they were taken by ambulance or the condition was serious, the converse suggests that over 50% of patients are therefore self-referred to an ED. Within this category it should be noted that the Australasian Triage Scale was not designed to be a measure of severity or a measure of health acuity, meaning that some patients may have a high complexity of care and will be admitted to hospital with a low urgency classification. This is particularly the case for older persons (PHIDU, 2023).
Nevertheless, there is a high number of patients presenting with less urgent conditions. This has led to a number of survey-based investigations (Siminiski et al., 2008; Cheek et al., 2016; O’Loughlin et al., 2021; Fatima et al., 2022) to understand the factors for the choice of presenting for less urgent conditions to the ED rather than to a GP. These studies report that those presenting to ED are often patients who are self-refers, who perceive before treatment, that their condition is complex requiring urgent attention. This issue highlights the gap in perception between the presenter seeing their presentation as urgent and the view of the ED staff who see the patient’s presentation as non-urgent under triage guidelines. They also perceive that GP services are less accessible for people who have their urgent requirements. Intrinsically, attending EDs may be more appealing to patients. This may be based on convenience as the ED do not charge to see a doctor whereas a co-payment may be required to see a GP. Attending an ED may result in being seen on the same day rather than waiting to acquire a GP appointment. Additionally, a patient may attend an ED because the ED’s locality is closer to work or home and can provide a single point-of-care for the patient in terms of diagnostics and treatment of their condition. The patient experience survey reaffirms this research with around 12% of respondents reporting that the GP did not have the required equipment or facilities and nearly 11% reported that they were sent to emergency by a GP (ABS, 2019).
Socioeconomic status is associated with less urgent presentations
Less urgent presentations have also been associated with lower area-based socioeconomic status across Australia. In Tasmania, there was an over-representation of ED presentations by people living in the most disadvantaged areas (Unwin et al., 2020). This relationship was also found in NSW, (Stephens et al., 2022). This relationship can be explored further across Australia and within States and Territories . Of significance in NSW is the interaction that both area-based remoteness and area-based disadvantage plays in the utilisation of the ED services. ED rates for all socio-economic categories were higher in rural areas compared to metropolitan areas across total, urgent and non-urgent presentation classifications (Stephens et al., 2022).
Age of patient is associated with less urgent presentations
Investigations into patient demand have also reflected the differing drivers associated with higher presentation rates from certain age groups.
Younger patients
The choice by parents to access the ED over the GP is apparent when accessing care for children. When parents are feeling the most vulnerable they are likely to prioritise technical expertise present at the ED over an established relationship with a GP when making a choice for healthcare (Cheek et al., 2016). Reasons for choosing the ED as their point of care (Freed et al., 2016) has found that fewer than half of parents attempted to make an appointment with a GP for their child prior to presenting to ED. Many believed that no appointments would be available and believed their GP would have recommended they come to the ED for their problem anyway. For over two thirds that did contact their GP, the GP instructed them to go to the ED for their child’s lower urgency condition. These instructions to present at an ED potentially reflect a range of non-clinical and clinical factors (Freed et al., 2016). These relate to the parent’s/caregiver’s influence, their request for onward referral, the parent’s perception of the severity of their child’s condition, the GP’s perception of the parent’s ability to cope with their child’s illness, their socio-economic status, a GP’s risk aversion to providing care to children and health system level factors such as access to specialist services not available at the GP (Conlon et al., 2020).
Older patients
For older patients, attending an ED may be more appealing to patients rather than going to a GP. Older patients with less urgent presentations were unlikely to give reasons associated with GP affordability or availability for their presentations with more emphasis on timely access to specialist care (Siminski et al., 2008). A later study (Lowthian et al., 2013) found other reasons, such as there was a preference of care by a family to attend ED rather than the GP, GP referral to the ED, unacceptable waiting times for their own GP, GP dissatisfaction (their GP worked part-time or was unavailable after hours and the patient didn’t want to see a unfamiliar GP at their regular GP clinic but they were not deterred to see an unfamiliar one at the ED) and the convenience of a ‘one-stop shop’ that offers specialist care within an institution of high repute. Additionally, the study highlighted that older people presenting to the ED may have additional ED presentation risk factors, namely, having diminished levels of social interaction which underpinned feelings of being socially disconnected leading to anxiety and depression. Focus group investigations (Faulkner and Law, 2015) have found that it was felt that some older people use the ED because of a lack of support at home and an inability to adequately care for themselves, or alternatively they used the hospital as a social outing because of the positive interactions they received.
Aim of the project
This study focuses on creating a three-year baseline of the geographic variation and temporal persistence of the utilisation of ED presentations at the small area level across Australia. The project follows on from previous PHIDU analysis of Potentially Preventable Hospitalisations for the Australian and Indigenous populations and the causes of Premature and Potentially Avoidable Death. These analyses draw on the work undertaken by Duckett and Griffiths (2016) published as “Perils of Place: identifying hotspots of health inequalities”.
The production of small area level indicators based on the rates of presentations for total and specific diagnosis chapters, the urgency of the care needed and demographic profiles provide valuable indicators of ED service utilisation. Quantifying the consistency of geographic variations over time can be used as multiple population health measures; summarising the supply of ED services to the community, providing an indirect measure of the local population’s health status, and highlighting areas where potential inequalities of ED presentation exist under Australia’s universal health care system.
Visualisation of the variation in heat between small areas and exploring the variation of heat within a small area will enhance our shared understanding of the geographic variation and temporal persistence of ED utilisation from people living in these areas. This evidence can inform policy makers to help strengthen current health care models or help deliver alternative care options providing pathways and solutions that are tailored and targeted to meet the needs and preferences of the underlying populations. This evidence also allows the bench marking of ED use which can act as evidence to justify and evaluate future interventions.
Data
ED presentations
The data presented are sourced from the AIHW’s National Non-admitted Patient Emergency Department Care Database (NNAPEDCD) (AIHW, 2023b), which is based on the Non-admitted Patient Emergency Department Care National Minimum Data Set/National Best Endeavours Data Set. The NNAPEDCD provides information on the care provided for non-admitted patients registered for care in EDs in public hospitals where the ED meets the following criteria:
- a purposely designed and equipped area with designated assessment, treatment, and resuscitation areas,
- the ability to provide resuscitation, stabilisation, and initial management of all emergencies,
- availability of medical staff in the hospital 24 hours a day,
- designated emergency department nursing staff 24 hours per day 7 days per week, and a designated emergency department nursing unit manager,
- a designated emergency department nursing unit manager.
Emergency departments (including ‘accident and emergency’ or ‘urgent care centres’) that do not meet the criteria above are not in scope for the NMDS, but data may have been provided for some of these by some states and territories (AIHW, 2020).
Analyses in this project were based on ED diagnoses, however, accuracy can vary due to the variation in coding systems and practices in each hospital. Unlike the admitted patient data collection, diagnoses are not formally coded by clinical coders but by staff working in each emergency department (HealthStats NSW, 2021).
The Diagnosis Chapter ICD-10-AM definitions were any reported principal diagnosis as per the below:
- A00–B99 (Certain infectious and parasitic diseases)
- F00–F99 (Mental and behavioural disorders)
- I00–I99 (Diseases of the circulatory system)
- J00–J99 (Diseases of the respiratory system)
- K00–K93 (Diseases of the digestive system)
- M00–M99 (Diseases of the musculoskeletal system and connective tissue)
- N00–N99 (Diseases of the genitourinary system)
- S00–T98 (Injury, poisoning and certain other consequences of external causes)
- Z00–Z99 (Factors influencing health status and contact with health services)
- C00–D48, D50–D89, E00–E90, G00–G99, H00–H59, H60–H95, L00–L99, O00–O99, P00–P96, Q00–Q99, R00–R99, U50–Y98 (Other)
The Australasian Triage Scale (ATS) (Australasian College for Emergency Medicine, 2023) is a clinical tool used to establish the maximum acceptable waiting time for medical assessment and treatment of a patient. The ATS aims to ensure that patients presenting to emergency departments are treated in the order of their clinical urgency and allocated to the most appropriate assessment and treatment area. The ATS utilises five categories classifying the time within which a patient should receive care:
- Category 1 – Resuscitation, an immediately life-threatening condition that requires immediate simultaneous assessment and treatment with patients seen within seconds
- Category 2 – Emergency; patients seen within 10 minutes
- Category 3 – Urgent; patients seen within 30 minutes
- Category 4 – Semi-urgent; patients seen within 60 minutes, and,
- Category 5 – Non-urgent, represents a chronic or minor condition which can be assessed and treated within two hours
States and territories provided emergency department diagnosis information in several classifications, including SNOMED CT-AU, International Classification of Diseases, 9th Revision, Clinical Modification (ICD-9-CM); and various editions of ICD-10-AM. For the purpose of reporting principal diagnoses, the AIHW mapped the provided information to ICD-10-AM 10th edition codes, where necessary.
A total of 23,715,106 records from three years of ED data are used in the analysis before missing data was removed. These are:
- 7,725,579 presentations to EDs between 1 July 2017 and 30 June 2018
- 8,021,560 presentations to EDs between 1 July 2018 and 30 June 2019
- 7,967,967 presentations to EDs between 1 July 2019 and 30 June 2020
The majority of data was mapped from the 2016 Australian Statistical Geography Standard SA2 to the PHIDU Population Health Area by the AIHW following PHIDU correspondence files. A total of 294,380 (1.2%) were not coded to a Population Health Area and a further 123,563 records had missing values which were not used in the analysis.
| State | Presentations | % of Australian presentations | % of Australian population |
| New South Wales | 8,484,672 | 36.4 | 31.5 |
| Victoria | 5,020,040 | 21.5 | 25.5 |
| Queensland | 4,413,751 | 18.9 | 20.3 |
| South Australia | 1,468,067 | 6.3 | 7.0 |
| Western Australia | 2,601,284 | 11.2 | 10.7 |
| Tasmania | 477,197 | 2.0 | 2.2 |
| Northern Territory | 438,939 | 1.9 | 1.0 |
| Australian Capital Territory | 393,213 | 1.7 | 1.8 |
| Total in analysis | 23,297,163 | 100 | 100 |
Table 2 shows that 36% of total presentations to the ED are from patients in NSW. This percentage reflects an overrepresentation of patients presenting to the ED compared to the proportion that the state of NSW has of the Australian population (31.5%). Table 2 shows the overrepresentation of ED presentations in the Northern Territory (NT) which has less than one percent of the population but around two percent of total ED presentations. The metropolitan versus non-metropolitan areas (includes Alice Springs and Surrounds) breakup shows that 1.1% of all presentations are undertaken by the NT non-metropolitan population which represent 0.4% of the Australian population. Similarly, non-metropolitan areas in Western Australia make up 3.3% of all presentations while representing 2.2% of the Australian Population. While these numbers seem small, contrasting these proportions to those in other state’s metropolitan and non-metropolitan areas show the influence on presentations from populations with a higher proportion of Indigenous Australians reflecting their options for health care in non-metropolitan areas.
Confidentiality of data
Counts of less than five presentations have been suppressed.
The Population Health Areas of 30057 Brisbane Inner - North - Central and 30051 Fortitude Valley/Spring Hill have been combined at the request of Queensland Health; data displayed is the combination of values and rates for these areas.
Extraction of ED presentation data by age group
In order to directly age-standardise the rates of ED presentations, we broke the Australian population level indicators into eight age groups categories (0-14 years old, 15-24 years old, 25-34 years old, 35-44 years old, 45-54 years old, 55-64 years old, 65-74 years old, 75 year plus). The majority of these classification represent a ten-year time period. This ten-year time period has been deemed acceptable in the standardisation process with very little difference between age-standardised rates using either five-year or ten-year age groups (AIHW, 2011).
Yearly data for each selected ED presentation category was merged with the corresponding yearly ABS ERP by age group at the PHA geography level.
To be included in the analysis there had to be three years of data in a PHA. If there was less then that PHA receives an NA value.
Geography of Analysis
The geography of analysis was the PHIDU Population Health Area geography (PHA). ED presentation data was sourced with PHA level geography. SA2s for the ERP data were corresponded to PHAs which comprise of a combination of whole ABS defined SA2s and multiple (aggregates of) SA2s. Nearly 40% of PHAs are combined of one SA2, another 38% have two SA2s with the other 22% of PHAs comprising of multiple combinations of SA2s.
The rationale for selecting specific types of ED presentations for analysis
The ED presentation dataset was split into a variety of indicators representing different ED presentation type categories. We provide an overall indicator of total presentations and then categorise this into eight age group categories to demonstrate the geographic variation in the demographic aspect of ED presentations. These categories were 0 to 14 years, 15-24 years, 25-34 years, 35-44 years, 45-54 years, 55-64 years, 65-74 years and 75 years plus age groups.
Demographic differences are apparent in the utilisation of ED care with research across Australian data (AIHW, 2018) and in the specific states of New South Wales (Dinh et al., 2016; Lower et al., 2020) and Western Australia (Aboagye-Sarfo et al., 2015). These studies show that annual age-based ED presentation have a U-shaped distribution with high utilisation at the 0 to 14 and 75 year plus age groups and lower presentation rates in the mid life age groups. Presentations in younger and older age groups are over represented when compared to their underlying populations. Dinh et al., 2016 suggests there may be scope to further investigate and improve healthcare strategies for young adults and the elderly in their study area (NSW), aimed at reducing the need for unplanned hospital presentations. Of interest is also the high rate of presentation for the 15-24 age group. While the rate of presentation is not overrepresented at the Australian population level there is evidence of over utilisation in rural and remote areas. For example, in NSW, the presentation rate for this age group in rural areas has been consistently more than double that of metropolitan areas (Lower et al., 2020 ).
To identify the geographic variation of the total presentations by principle diagnosis we categorised total presentations into 10 diagnosis classes based on their corresponding chapter groups. These were:
- Certain infectious and parasitic diseases
- Mental and behavioural disorders
- Diseases of the circulatory system
- Diseases of the respiratory system
- Diseases of the digestive system
- Diseases of the musculoskeletal system and connective tissue
- Diseases of the genitourinary system
- Injury, poisoning and certain other consequences of external causes
- Factors influencing health status and contact with health services
- Other
The overrepresentation of younger and older Australians in ED presentations as identified by the U-shaped distribution warrants additional focus into what diagnosis these age groups are presenting for. As such, we have extracted younger and older age groups from specific diagnosis chapters where numbers have been sufficiently large enough to derive robust yearly rates with coverage across Australia. Where number were large, we extracted data for certain diagnosis chapters which related to the age of the presenter. For example, presentations for diseases of the circulatory system are markedly higher for older than younger age groups. Additionally, there is specific interest in the usage of the ED department for certain age cohorts by specific type of diagnosis, such as, the presentation to the ED for younger Australians with a diagnosis of mental health issues. For example, ED mental health re-presentations are high among young people, with one in four re-presenting with a mental health concern within one year of their first ED presentation (Cullen et al., 2022). This study suggests that there is a significant need to strengthen the navigation pathways out of the ED, which may vary in particular areas, to provide follow-up mental health care into community-based primary and mental healthcare services that are more appropriate than recurrent visits to the ED.
One major diagnosis contributor to ED presentations is the Injury, poisoning and certain other consequences of external causes category which represents nearly 25% of all ED presentations within the dataset. As presentation numbers are large we have provided the age-specific breakdown for all age groups within this diagnosis category. The indicators extracted include:
- Certain infectious and parasitic diseases aged 0 to 14 years
- Mental and behavioural disorders aged 15 to 24 years
- Mental and behavioural disorders aged 25 to 34 years
- Mental and behavioural disorders aged 35 to 44 years
- Diseases of the circulatory system aged 55 to 64 years
- Diseases of the circulatory system aged 65 to 74 years
- Diseases of the circulatory system aged 75 years plus
- Diseases of the respiratory system aged 0 to 14 years
- Diseases of the respiratory system aged 15 to 24 years
- Diseases of the respiratory system aged 65 to 74 years
- Diseases of the respiratory system aged 75 years plus
- Diseases of the digestive system aged 25 to 34 years
- Diseases of the digestive system aged 35 to 44 years
- Diseases of the digestive system aged 45 to 54 years
- Diseases of the musculoskeletal system aged 45 to 54 years
- Diseases of the musculoskeletal system aged 55 to 64 years
- Injury, poisoning and certain other consequences of external causes – all eight age groups
The ATS provides a measure to assess the urgency of an ED presentation. The ATS classifications of 1, 2 and 3 are often combined to investigate high acuity (needing urgent care) patients. Temporal analyses have found that these patients who require admission to inpatient beds are contributing substantially to the increase in ED presentations and place a significant threat to existing ED resources (Morley et al., 2018). For these more urgent presentations, a similar U-shaped curve is again apparent demonstrating higher presentation rates for younger and older patients (PHIDU,2023). A component of this distribution is made up of higher rates of presentations hospital admissions, for the older age groups in the more urgent triage categories (triage category 1 and 2). The majority of presentations, however, is made up of presentations for the Urgent triage category (ATS 3). In 2019/20, this category made up around 39% of total presentations and 50% of presentations admitted to hospital (PHIDU,2023). Within more urgent category, older Australians have higher rates of presentation and hospital admission after this presentation (PHIDU,2023). These high rates demonstrate the need for this type of care and identifying the geographical trends in these types of presentations may help identify which models of care require additional resourcing (Dinh et al., 2015). We therefore provided total presentations for the aggregation of the ATS 1, 2 and 3 categories, which we classify as Urgent presentations, as well as a break-up of these types of presentations by the 0 to 14 years, 65 to 74 years and 75 years plus age groups.
The ATS’s lower urgency triage categories 4 and 5 are also used to define patient presentations as low acuity although there is conjecture over the appropriate definition to be used (Stephens et al., 2017). It is often proposed that these patients would be better managed in primary care rather than in the ED. When investigating these triage categories by age group for the 2019/20 ED dataset, a reverse J-shaped distribution was found with higher rates for the younger age groups, the majority of which were not admitted to hospital (PHIDU, 2023). Other research has shown that patients in the younger age groups (10-19 years) tend to be the strongest predictor of low acuity ED presentations (Dinh et al., 2016a). For example, presentations from patients in the 0-4 year age group traditionally see larger volumes of lower-acuity care (Aboagye-Sarfo et al., 2015) with attendances during non-business hours and weekends (Stephens et al., 2017). We therefore provided total presentations for the ATS 4 and 5 categories, which we classify as Non-Urgent presentations, as well as a break-up of these types of presentations by the 0 to14 years, 15 to 24 years and 75 year plus age group categories.
Methodology
Using the Empirical Bayes process to calculate small area ED presentation rates
Overview of the Empirical Bayes approach
The calculation of crude or age-standardised ED presentation rates has the potential to produce large unreliable rates of utilisation for small areas. This occurs when presentations are rare occurrences, such as for a specific age-related presentation or when they are collected over small time periods such as annually. The corresponding populations used in the process also pose an issue, with small age-specific populations within each PHA inflating the estimate of the crude or age-standardised rate. When looking at very rare events like mortality, Benach et al., 2003 suggests that the large heterogeneity in population size across areas leads to various levels of precision of area specific mortality risk estimates and that age-distribution differences across areas result in mortality risk estimates that are influenced by age effects. The outcome of these issues is a wide variation of rates which makes comparison of rates across small areas difficult. For example, when locations of high population density are compared to ones with lower population densities, the calculated age-specific ratios do not reflect the relative sizes and relatively equal rates from these areas may in reality be quite different from each other (Türkan et al., 2020). Additionally, Yasaitis et al., 2015 suggests that there are calculation issues when an investigator wishes to explore local health phenomena where the populations are too small to create statistically stable estimates.
The Empirical Bayes (EB) estimator has been proposed as one method to reduce these potential fluctuations particularly when it comes to estimating mortality rates at the small area. However, ED presentations are much more frequent events than death and as such traditional estimates of utilisation rates have continued to be used.
When we implement the Empirical Bayes methodology, the process weighs the information of the small area of interest together with the information from all areas under investigation (Benach et al., 2003). This involves the creation of a prior distribution of relative risks in the form of a probability density function where the prior distribution reflects prior beliefs about the distribution of relative risks and this is parameterized by hyperparameters (Leyland et al., 2005). The use of the hyperparameters smooths or shrinks the observed value, improving the estimate by borrowing strength from the values of all observations in order to produce more stable estimates. In practice, those areas with smaller populations will have their rates smoothed more or shrunk towards the mean more than areas with larger populations.
One criticism of the EB approach is that there is over shrinkage towards the mean with the result that the variance of a collection of EB estimates will underestimate the variance of the true rates (Leyland, 2005). For ED indicators with more common occurrences, the amount of shrinkage towards the mean diminishes and the need for adjustment by the EB methodology is reduced. Several sensitivity studies (Congdon, 1994; Yasaitis et al., 2015) have demonstrated that the EB methodology tended to adjust all values to the global mean with more sparsely populated areas adjusted more drastically. These studies suggest that the EB methodology is a very conservative approach to estimate ED presentation rates.
Estimating a prior from the dataset for each age group and ED indicator category
Traditionally, the rate of ED utilisation of an area (PHA) is defined as an age-standardised rate, standardised to the 2001 standard population. This considers that the relative risks of presentation for specific indicators differ with different ages. This calculation uses the relative risk, calculated as the number of presentations divided by the population in each age group. These relative risks are standardised to the 2001 standard population by a ratio of the 2001 age group to the total 2001 population. The age group rates are then summed over all age groups to create an overall aggregated age-standardised rate of utilisation for an indicator in a PHA. The number of presentations, the size of the populations and how these are distributed over the eight age groups within the PHA will therefore influence the PHA age-standardised rate of presentation rate. The presentation rate per PHA is defined as the number of presentations per 100,000 population in a calendar year.
We used the ebbr package (Robinson, 2017) utilising Empirical Bayes estimation to estimate the age standardised rates of presentations for the selected range of ED presentation types. We ran the package separately on each of the eight age groups for each type aggregated over the three years assuming the distribution followed a binomial likelihood function. This meant that each age group had 1,165 observations, the number of PHAs in Australia, holding the three-year aggregate of presentations and populations for each PHA. The distributions included PHA’s where no presentations were reported and in the rare occurrence when ED presentations exceeded the population we set the value to not exceed 100%.
Gao and Dong, 2020 describe the relationship as:
Y ~ Binomial (θ, N)
Where Y is the observed number of presentations, θ is the unknown prevalence and N is the population size. θ is the unknown parameter whose values we assume to be modelled using a Beta probability distribution. This distribution has the advantages of flexibility in the fitting of models and in modelling data such as ED presentation rates (number of presentations/population) with values between 0 and 1.
A specific Beta prior for each age group over the three years of data is then calculated by:
θ ~ Beta (α, β)
The Beta distribution has two shapes; α (Alpha) and β (Beta) whose values represent different degrees of prior knowledge on the likely values of θ. Alpha and Beta are called the hyperparameters of the model and can be calculated from the most likely values estimated using Maximum Likelihood Estimation.
For each age group, the estimated three-year average hyperparameters (α and β) are used to adjust the annual age-specific crude ED presentation rates for each type of ED category for each PHA using the equation:
EB fitted rate = (ED presentations in PHA+ α)/(Population in PHA + α+ β)
Where α, β are the estimated hyperparameters for each age-specific category derived from ED presentations within a type of ED category and PHA populations over the three years.
Worked examples of the EB calculation to estimate age-standardised ED presentation rates for mental health ED presentations
Step 1 Estimation of the prior probabilities
We ran the ebbr package on each of the eight age group categories for patients presenting to the ED having a mental or behavioural disorder.
Figure 3 to Figure 10 show the Beta distribution density plots (left panels of the figures) and the comparison of values between the EB fitted crude ED presentation rate per PHA with the crude ED presentation rate per PHA for the eight age group categories. The dynamics of the Beta distribution for the 0-14 age group category is characterised as tall and peaked modelling the low rate of crude ED presentation rates across the three years of analysis. The Beta distribution range expands as crude ED presentation rates per PHA increase with age until the 45-54 years age group category. The range of the Beta distribution then declines until the 75 years plus age category which again shows large crude presentations rates per PHA for the mental and behavioural disorders category.
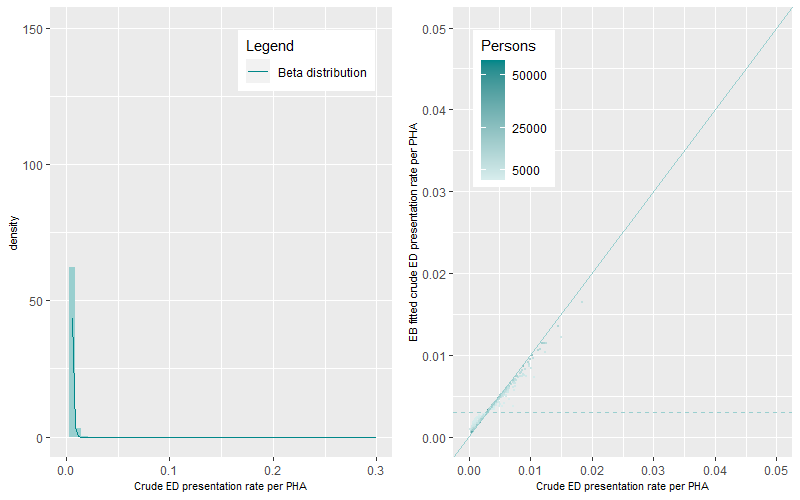
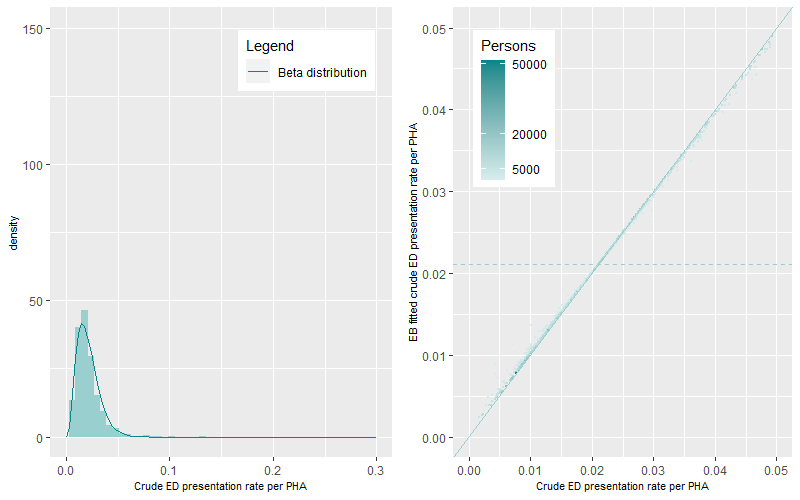
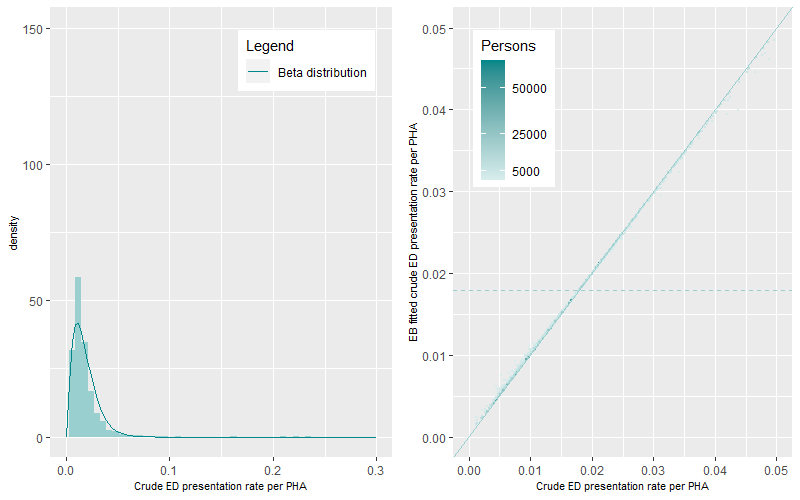
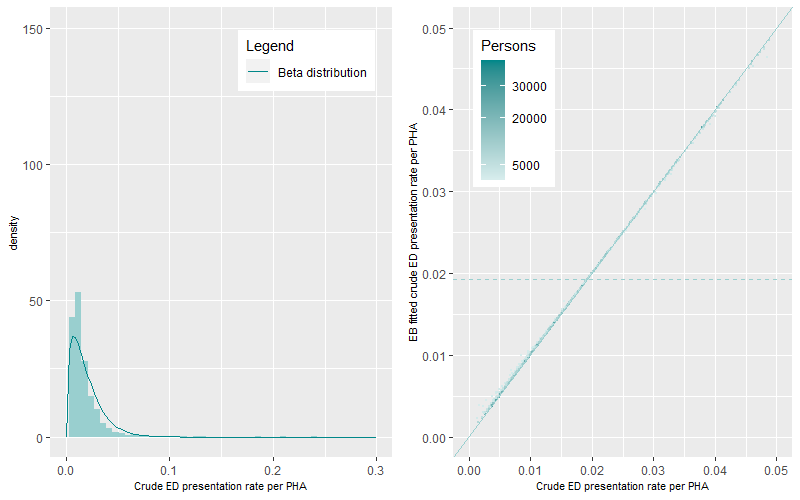
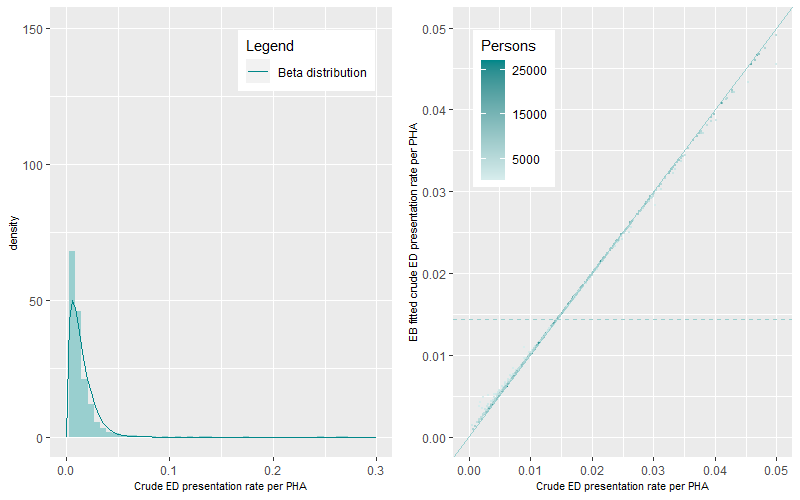
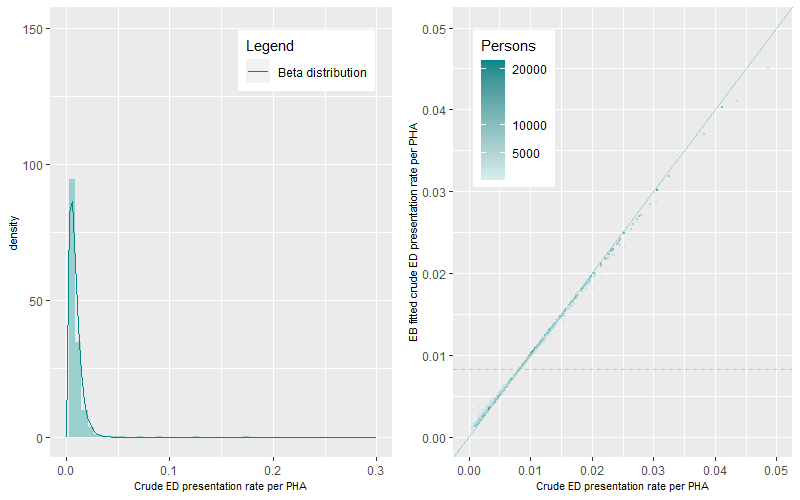
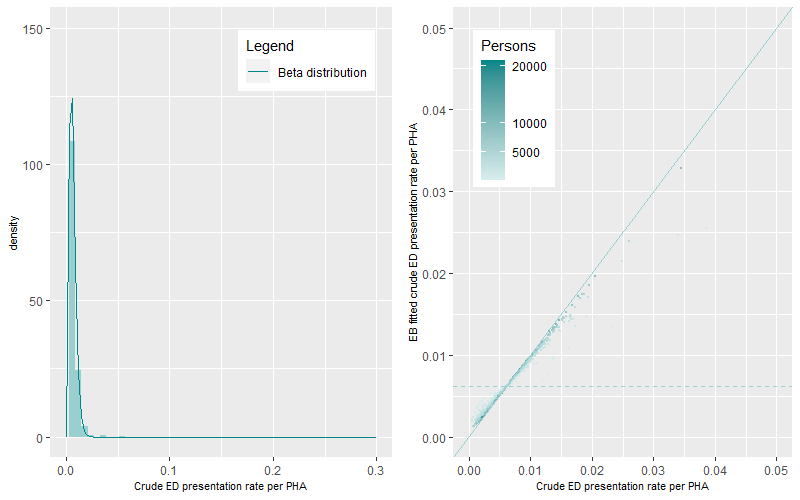
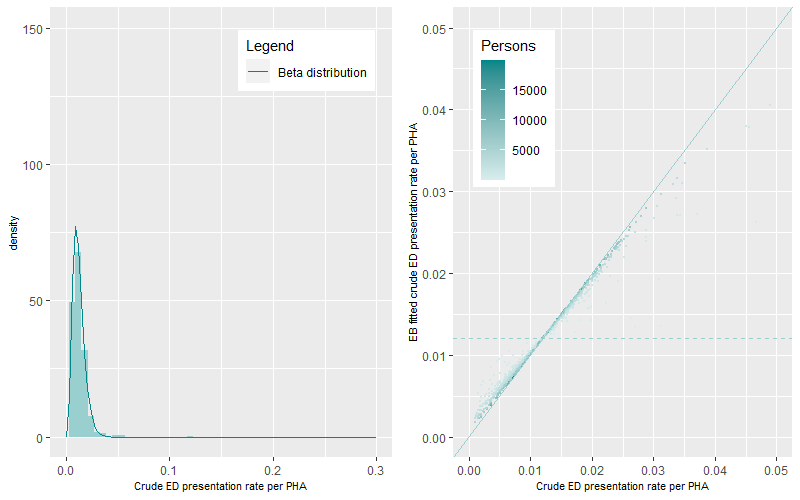
The prevalence of ED presentations for mental and behavioural disorders differs by age group. Comparison between the EB fitted crude ED presentation rate per PHA and the crude ED presentation rate per PHA (right panels of the figures) show very good agreement between rate values illustrated by the tight clustering of values around the one to one line (45 degree line) across all age groups. The dashed line represents the mean age group specific EB fitted crude ED presentation rate. The darker points represent PHAs with higher populations while the lighter coloured points represent PHAs with lower populations. A similar pattern occurred across all figures, darker points are apparent near the 1:1 line demonstrating minimal shrinkage to the mean. Lighter coloured points show two contrasting patterns of rate prediction caused by the smoothing and shrinkage of rates towards the mean. Lower rates of crude ED presentation rates per PHA are smoothed to the mean to derive higher EB fitted crude ED presentation rates per PHA. Higher rates of crude ED presentation rates per PHA are shrunk to the mean to derive lower rates of EB fitted crude ED presentation rates per PHA. PHAs with high crude rates and high populations are also shrunk to the mean but by less than those with lower populations.
Step 2 Calculation of the EB fitted annual ED presentation rates by PHA by type of ED presentation category
Two types of ED presentation data are collated in this study. The first is ED presentations by age group. This dataset uses the EB estimation on the age group defined crude rates only as highlighted in the Step 1 above. The second is the calculation of ED presentation rates for the whole population using the direct age-standardisation method.
The EB fitted ED presentation rate per PHA for the whole population is the aggregation of all eight individual age-specific EB fitted ED presentations rates which are then directly age standardised to the 2001 population. This is undertaken so that comparisons can be made across time. Standardisation to the 2001 population is achieved by multiplying each age group specific EB fitted ED presentation rate by the ratio of the age group population in 2001 divided by the total 2001 population. These adjusted rates were then aggregated to get an overall EB fitted age-standardised ED presentation rate per PHA per year. Crude ED presentation rates were also age-standardised for comparison to the EB fitted age-standardised ED presentation rate per PHA per year.
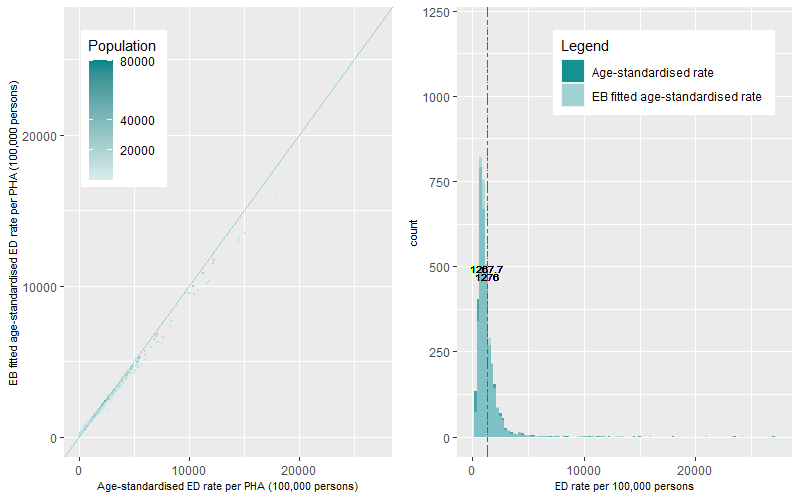
Figure 11 (left panel) shows the scatterplot of the ED presentation rate distributions (EB fitted versus Age-standardised) for the Mental and Behavioural Disorders category while Figure 11 (right panel) shows the histogram of the rate distributions. Both plots show that the ED presentation rates are positively skewed with a long tail of outlying high rates. The average age-standardised ED presentation rate was 1,276 presentations per 100,000 persons over the three years. This compares to a lower average EB fitted age-standardised average ED presentation rate 1,268 presentations per 100,000 persons. The dynamics of the distribution of the EB fitted age standardised ED presentation rates shows a more peaked and tighter distribution when compared to the distribution of age-standardised ED presentation rates.
Some cautionary notes
We conducted an Empirical Bayes approach to estimate ED presentations rates at the PHA small area level across Australia. We undertook this to remove the influence of small numbers (both the number of ED presentations and populations) on the calculation of annual PHA ED presentations rates. In general, we cannot easily distinguish between what is the true ED presentations rate of a PHA, what variation is caused by statistical issues and what is the degree of over smoothing or bias that is imposed by the EB methodology.
Hotspot analysis – Identifying the geographic variation and temporal persistence of ED presentation hots spots across Australia
We now have estimates of annual rates of ED presentations for each PHA which have been adjusted for known statistical issues. To identify the geographic and temporal persistence of rates of ED presentations we undertook four steps:
- The first step involved deriving ratios between the annual EB fitted ED presentations by PHA by type of ED presentation category to their corresponding annual Australian average of the EB fitted ED presentation rates. For example, values of 0.5 or 1.5 meant a rate that was 50% lower or 50% greater than the Australian rate while values of 2 or 3 meant rates were two to three times greater than the Australian rate.
- The second step compared these ratios to a range of thresholds. This was undertaken to understand the sensitivity of the ED presentation rates within the PHA for each year and discern the disparities between PHA. A total of 20 thresholds were selected with the lowest threshold set to 50% of the Australian rate and the highest set to four times the Australian rate for each year. We recorded a value of one, when the ratio was higher than each threshold while a value of zero was recorded when it was lower over the three years of analysis.
- In the third step we aggregated the three years into a three-digit code for each PHA by ED presentation categories. This created unique codes of when the PHA was either above or below a chosen threshold for the three years, as a whole. The codes were then classified into five categories; Cold, Cold-Warm, Warm, Warm-Hot and Hot based on a set of aggregation rules.
- This fourth step produced a dataset summarising the heat of ED presentation categories by PHA and threshold. This information was used for input into the interactive web-based maps and heat map graphs.
Some results
The influence of NSW ED presentations
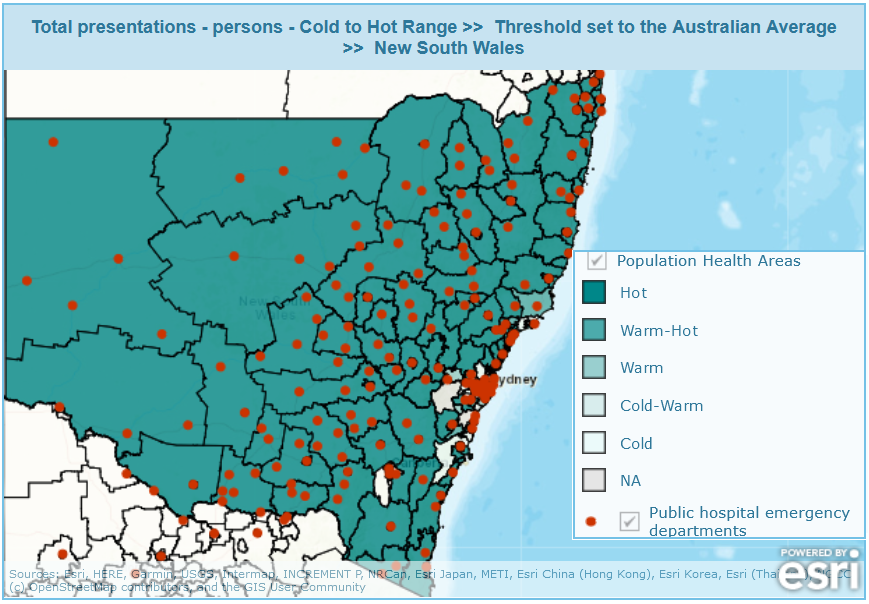
The majority of presentations to EDs occur in NSW. Table 2 shows that 36% of total presentations to the ED are from patients in NSW. This percentage reflects an overrepresentation of patients presenting to the ED compared to the proportion that the state of NSW has of the Australian population (31.5%). This overrepresentation reflects that 174 (60%) out of all 293 public EDs across Australia were in New South Wales (AIHW, 2022). Figure 12 shows this distribution with the heat threshold set to the Australian average. In comparison to other states, around 13% (n=39) are in Victoria, 9% (n=26) in Queensland, 8% (n=24) in Western Australia, 6% (n=18) in South Australia. Less than 2% of all EDs are in the Northern Territory ( n=6), Tasmania (n=4) and the Australian Capital Territory (n=2).
A further break down by metropolitan versus non-metropolitan areas categories identifies a significant overrepresentation of people from non-metropolitan areas to the ED. Half of these NSW presentations (18%) are from people living in non-metropolitan areas which encompass 11% of the Australian population. This overrepresentation is also apparent in age-based and triage categories. For example analysis of the three years of data found 22% of presentations for the triage categories 4 and 5 (classified as Non-urgent presentations) were for people living in non-metropolitan NSW which made up 11% of the Australian population. When this category is broken up by the 0 to 14 years, 15 to 24 years and 75 years plus age group categories over 20% (19.6%, 23.1% and 27%, respectively) of presentations were for people living in non-metropolitan NSW which made up 11%, 10% and 14% of the Australian population for these age groups.
This large number of ED presentations for NSW reflects results found by Stephens et al., 2017 where higher ED utilisations were apparent in areas of decreasing GP density in inner regional and remote/very remote areas compared to major cities in NSW. These locational differences reflect the geographic variation in GP density and the policies used to provide alternative points of care for patients in specific regions of Australia. In rural and remote areas of NSW, these higher utilisations reflect an alternative model of care in these areas through the Multi–Purpose Services Program (MFPP) which integrates a range of health care services to deliver improved health outcomes for these local communities (New South Wales Government, 2023). Of the 174 EDs in NSW, 50 (29%) belong to the MFPP. The model is thought to be responsive and has flexibility of services to meet community needs (Anderson and Malone, 2014). Cheek et al., 2016 also suggest that providing low-acuity care in parallel with providing a specialised emergency service meets the needs of the local community and is likely to be the lowest cost model in a regional and rural area. The number of ED presentations and the physical presence of ED locations coupled with a state policy of care (MFPP) means that a greater proportion of presentations are undertaken in these areas compared to the underlying population. This issue of overrepresentation of patients in non-metropolitan NSW is reflected in Figure 12 with small areas in the rural and remote regions of NSW being “Hot” for the Australian average or greater thresholds.
Hotspot differences for the Total Presentation ED category by Australian State and Territory
There are large variations in the number of hotspots identified across Australia. This variation differs by geographic location and by type of ED presentation category. The percentage of PHAs within each state or territory that are consistently, across three years, above (“Hot”) or below (“Cold”) the EB fitted Australian rate of the Total Presentations ED category are shown in Figure 13. These classifications represent the two extremes on the heat classification spectrum.
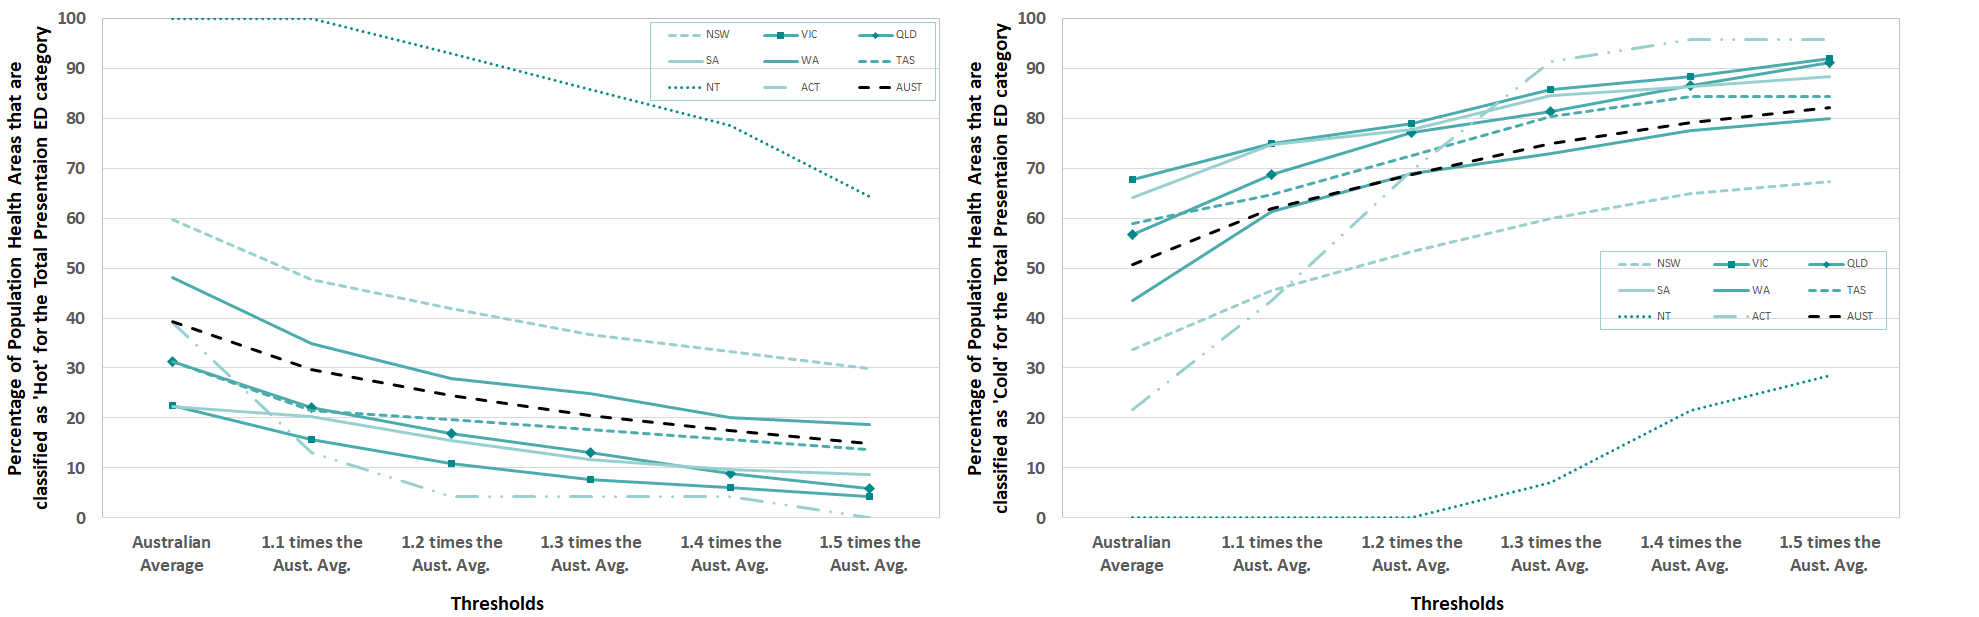
Around 39% of all PHAs across Australia were classified as “Hot” i.e. those areas that had total ED presentations consistently over the Australian average for the three years of data investigated. The percentage of PHAs that were classified as “Hot” within a state or territory were by far the highest in the Northern Territory (NT), followed by New South Wales (NSW) and Western Australia (WA). This heat classification and threshold represented all of PHAs in the NT, 60% for NSW and 48% for WA. As the thresholds increase the percentage of PHAs that are “Hot” decrease. At the 1.5 times the Australian average threshold rate, the percentage of all PHAs classified as “Hot” reduces to 15%. The NT and NSW still have 64% and 30% of PHAs that are classified as “Hot” at this threshold.
At the opposite end of the spectrum, around 51% of all PHAs in Australia were consistently below the Australian Average threshold and were classified as “Cold”. Within a state or territory, the percentage of PHA’s that were classified as “Cold” at the Australian average threshold were highest in Victoria (VIC) at 67%, followed by South Australia (SA) at 64%. The percentage of PHAs that are “Cold” increases as the thresholds are increased. At 1.5 times the Australian average, the majority of PHAs (79%-96%) in all regions except NT and NSW are classified as “Cold”. Both figures show high percentages of PHA that are either “Hot” or “Cold” this is due to only three years of temporal analysis being undertaken.
Examples of the geographic clustering of hotspots by type of ED presentation category
In this section, we provide comparative examples of the geographic clustering of PHAs which have been classified as “Hot” for the 50% (1.5 times) more than the Australian average threshold. The clustering highlights areas where a greater understanding is required about the underlying issues that drive ED presentations, such as the health status and health care options that are available to patients living in these PHAs, and where more targeted interventions could potentially take place to reduce the reliance on the ED for their health care.
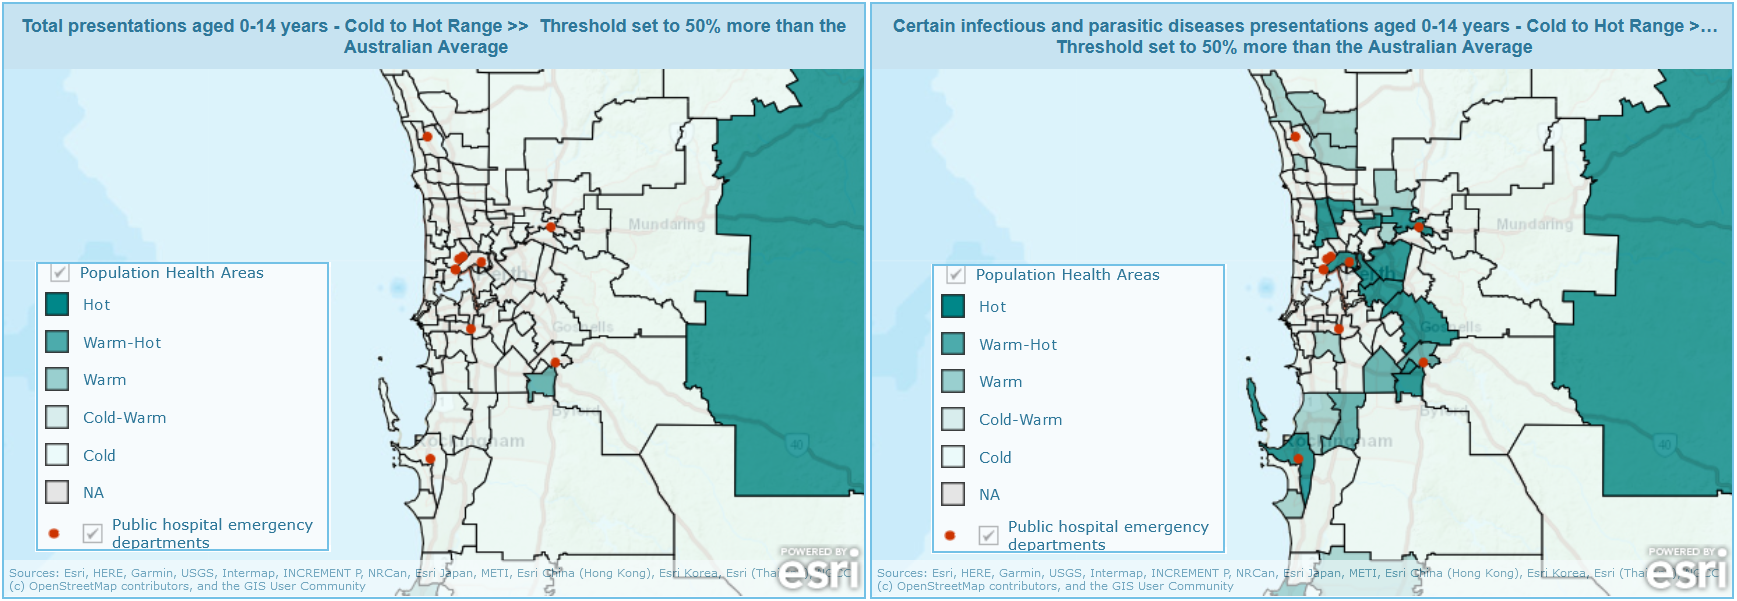
For the total ED presentation type who are aged 0-14 years there is no clustering in the Perth metropolitan area (Fig.14 left panel). In comparison, when we look at a specific type of ED presentation category which is related to this age category, such as the certain infectious and parasitic diseases category, there is considerable clustering of “Hot” areas in the eastern PHAs of the Perth metropolitan area (Fig 14 right panel).
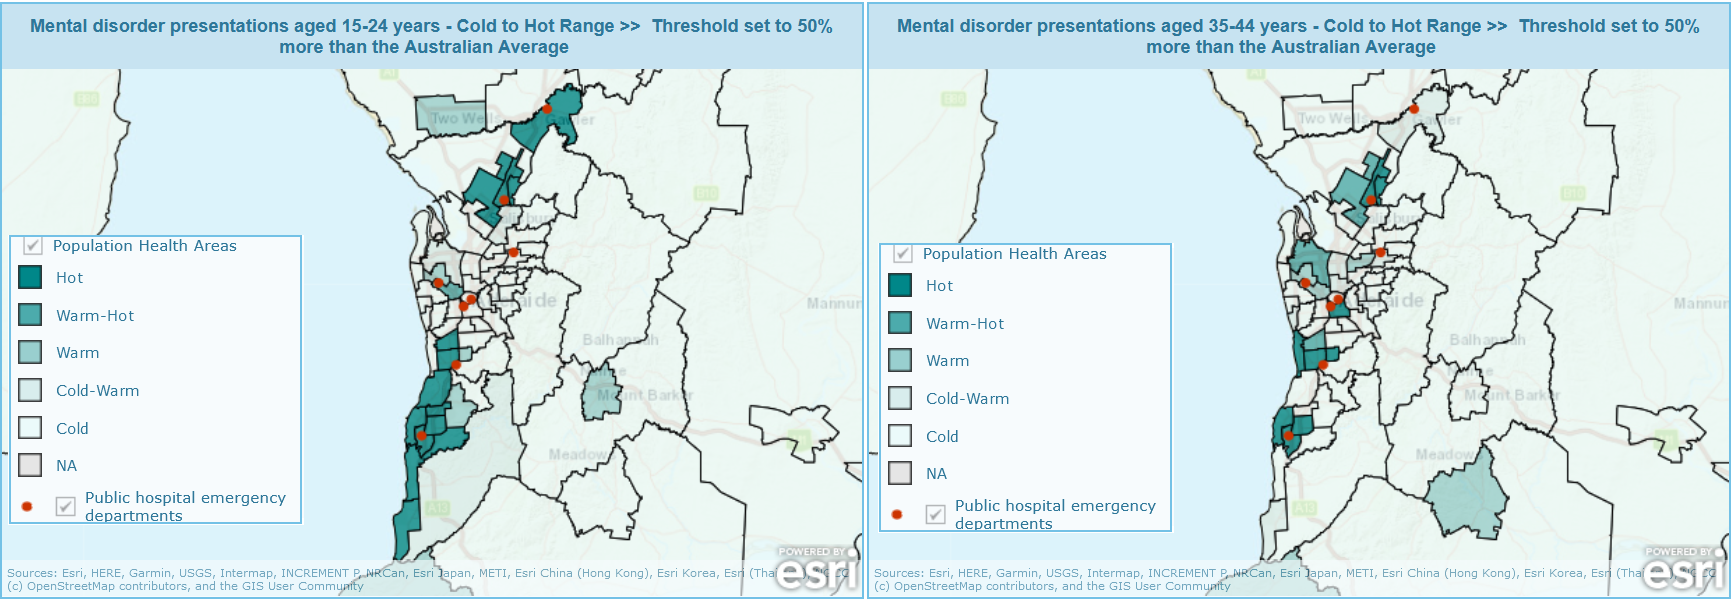
For presentations for Mental and behavioural disorders (mental disorder presentations) for those aged 15 to 24 years (Fig.15 left panel), we find a clustered pattern in the north and an extended clustered pattern in the south of the Adelaide metropolitan area. This pattern is similar for this ED category for those aged 35 to 44 years (Fig 15 right panel) but now with two distinct regions in the south classified as “Hot” and larger region of clusters of hotter PHAs in the west of the map.
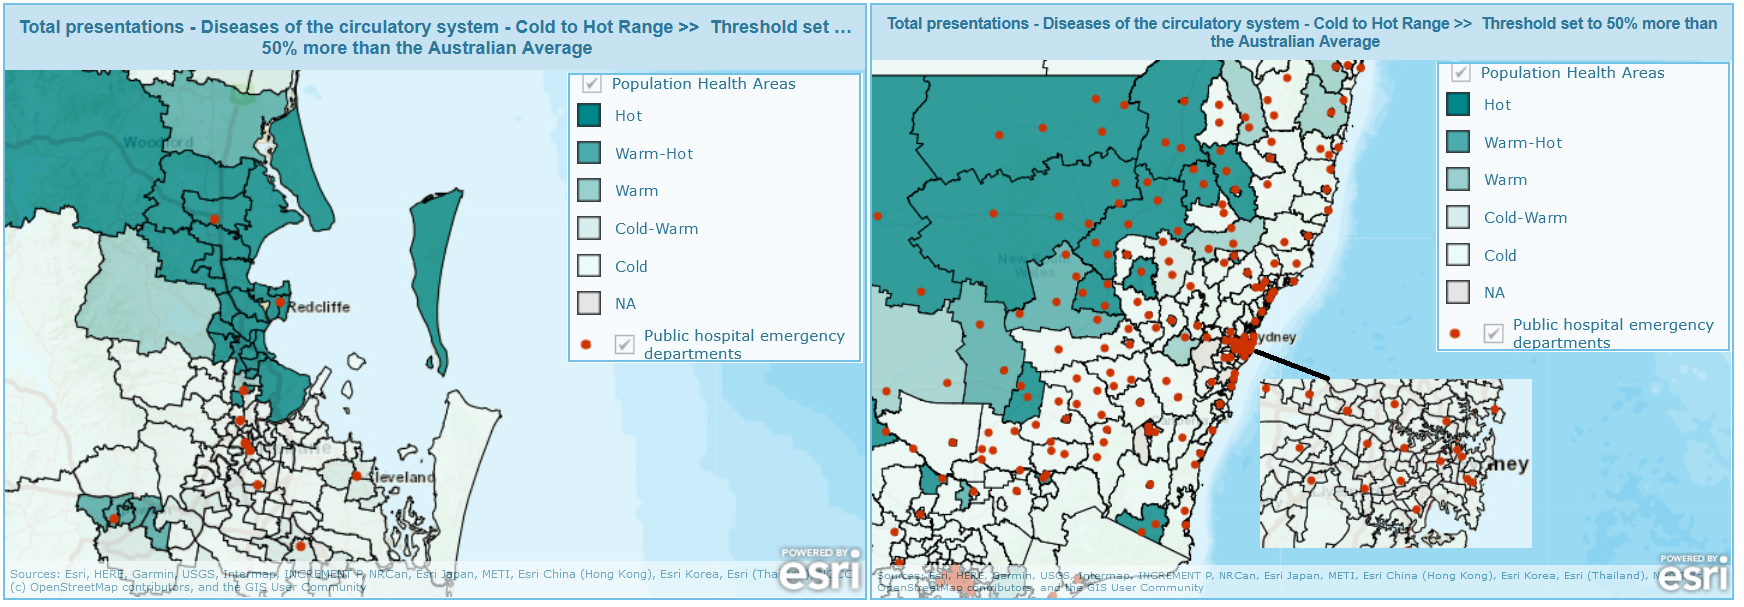
For total presentations for diseases of the circulatory system ED category, we find a clustered pattern of “Hot” PHAs in the coastal northern and south western areas of Brisbane (Fig 16 left panel). This compares to NSW, as a whole, where the outer regional areas have been classified as “Hot” and the majority of PHAs in the Sydney metropolitan region have been classified as “Cold” for this ED category and threshold (Fig 16 right panel).

For total presentations for the triage category 1, 2 and 3 classified as Urgent for patients aged 0-14 years, we find that these types of presentations are clustered in areas around, but not including, Devonport and in Burnie within Tasmania (Figure 17 left panel). The rest of the state is classified as “Cold” in relation to the 50% more than the Australian average for this ED category. This trend compares to PHAs in Brisbane where four clusters of hot PHAs can be found for this age and ED category (Figure 17 right panel).
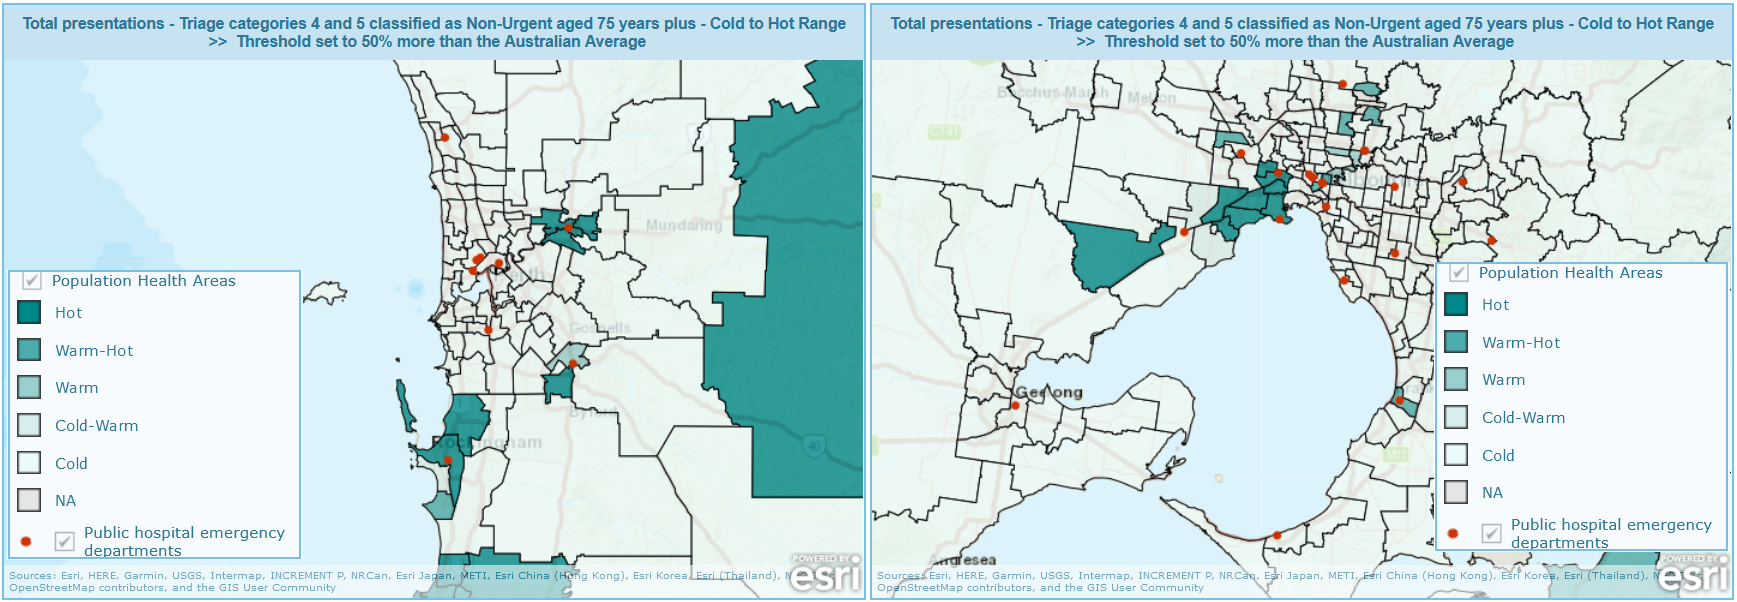
For total presentations for the triage category 4 and 5 classified as Non-Urgent for patients aged 75 years plus, we find that these types of presentations are clustered in three areas in Perth (Figure 18 left panel) for the 50% more than the Australian average threshold. This trend compares to PHAs in Melbourne where one cluster of hot PHAs can be found for this age and ED category (Figure 18 right panel).
Is there potential to strengthen community care and primary care services to reduce ED presentations in the future?
The primary health care system is a large, comprehensive and important part of Australia’s health system but access to some services is limited, some care is poorly integrated between levels of health care while other services lack continuity and coordination (Swerissen et al., 2018). This situation coupled with the ageing of the Australian population will continue to place increasing stress on the ED to provide high quality care and on the limited resources from government funding. Data investigating the long-term health conditions of the Australian population collected through the 2021 Census (ABS, 2022) found that over 8 million people or 31.7% of the Australian population had at least one long-term health condition. The median age of those with a long-term health condition was 55 years with the proportion of those with a long-term condition increasing with age. Those aged 55 to 74 years who comprise 21.5% of the Australian population accounted for 34.2% of those who had at least one long-term health condition. This overrepresentation meant that half (50.4%) of this cohort had a long-term health condition. These issues suggest that the identification and strengthening of specific clinical pathways, by increasing the effectiveness of treatments in primary care could reduce ED presentations. Several studies have investigated this approach with mixed results relating to the type of presenter and presentation category.
Frequent attenders often comprise a small number of people, who nethertheless place a significant demand on and use a disproportionally large share of the resources of ED services. For example, Lago et al., 2019 found 2.6% of those who attended ED met their criteria as frequent attenders and over the 10 years of analysis those that were classified as persistent frequent attenders (n=607) made 38,338 ED visits. EDs are often poorly equipped to address the multi-dimensional nature of patient need and the complex circumstances surrounding repeated presentation (Baird et al., 2021). Baird et al., 2021 describes the Checkpoint program undertaken to improve care coordination through proactive case management in the community. This program has been found to reduce ED re-presentation rates with the greater benefit achieved in the second year after the program was implemented. Within the patient cohort (n=106) of those under 70 years of age who had multiple unplanned presentations (10 plus), there was a 53% reduction in ED presentations.
For older and elderly patients with chronic conditions, an earlier study (Billot et al., 2016) into the New South Wales Health Chronic Disease Management Program (n=25,638, 44% 75 year or more) which delivers interventions to adults at risk of hospitalisation found a significant increase (37%) in ED presentations. Similarly, the evaluation (Ward et al., 2021) of the Australian Gold Coast Integrated Care programme (n=1,549, age 54-75 years and above) targeting those with chronic and complex conditions at the highest risk of hospitalisation showed an increase (36.2%) in ED presentations on a one-year follow up. Both authors suggest that the greater attention to patients highlighted an unidentified health need which required an ED presentation and that this found need was an advantage of the extra attention of a strengthened primary health care. Alternatively, the HealthOne Mount Druitt programme established for older people with chronic and complex illness who are at risk of further exacerbation and/or hospitalisation and who would benefit from care planning and case management reported a decrease in ED presentations (McNab and Gillespie, 2015; Mallitt et al., 2017). Of a sample of 125 patients, mean age 68.4 years, the average number of ED visits decreased 24% from an average of 3.1 presentations per patient 12 months prior to 2.3 presentations per patient 12 months after. A more recent preliminary evaluation (Cheung et al., 2019) of the Western Sydney Integrated Care Program investigating patients (n=1,350, mean age 65 years) with similar chronic conditions to the above study (Billot et al., 2016) found some evidence in the reduction (32%) in presentations to the ED.
Reviews of alternatives health care choices to the ED have highlighted alternative care pathways such as walk-in clinics, out-of-hours primary care services, GP cooperatives mainly operated out of hours or telephone advice lines (Crawford et al., 2017). Willson et al., 2022 noted that in the provision of acute care a whole-of-system approach would be needed with potential policy changes to include GP clinics incorporating emergency appointments, GP triage, further patient streaming and changes to the ED medical workforce model, as well as linking hospitals with primary health care clinics. They also suggest system changes that include improving rapid access to non-GP specialists, offering qualifications for urgent care within primary health care clinics, developing integrated information technology systems and educating patients regarding appropriate healthcare system pathways. These alternatives require future evaluation to determine if they offer potential alternative pathways of health care, particularly to those patients in PHAs that we have identified as "Hot".
Emergency Department Presentations: Identifying hotspots of inequality - Maps
Emergency Department Presentations: Identifying hotspots of inequality - Maps
Emergency Department Presentations: Identifying hotspots of inequality - Data
Emergency Department Presentations: Identifying hotspots of inequality - Data
Authored by PHIDU